PEER REVIEWED
Feedback Changes Metacognitive Accuracy
Over Different Time Scales
Kevin T. Willeford, OD, MS, PhD, Nicole Patterson, OD, MS, and Jamie Althoff, OD
Abstract
The goal of this investigation was to determine how optometry students utilize metacognitive feedback. This was done as part of a national board examination preparation course by asking third-year optometry students to make sequential retrospective confidence judgements regarding the probability that a “just-given” answer to a question was correct. Metacognitive accuracy was quantified on three temporal scales: “item-by-item,” “single session” and “whole course.” Each analysis showed that our cohort of optometry students consistently underestimated their ability to answer correctly even when shown they had just answered (item-by-item) or were continuing to answer (single session and whole course) correctly.
Key Words: metacognition, metacognitive accuracy, confidence
Background
The ability to assess one’s thought processes is known as metacognition.1 Metacognitive accuracy, the degree to which someone “knows what they know,” is often assessed through assigning probabilistic judgements to decisions.1,2 This practice can be instantiated in classroom and/or laboratory settings by asking students to issue a confidence rating that expresses the probability that a “just-given” answer is correct.3 For example, “You told me that hyperopic eyes have less power. How confident are you that this is correct?” The student’s metacognitive accuracy is determined by comparing their judgement (confidence rating) and outcome (correctness). Students exhibit accurate metacognition when their judgement and the outcome are aligned (e.g., confident and correct), whereas erroneous metacognition is evidenced by a misalignment between their judgement and the outcome (e.g., confident and incorrect).
A student’s overall metacognitive accuracy, assessed throughout a class session or throughout a course, can be quantified using several metacognitive indices that summarize multiple judgements and outcomes.4 The first metric is error (E): a mismatch between a student’s average confidence rating and their average correctness. Consider a student who is typically 75% confident and 75% correct: They have zero error because their average confidence level matches their average correctness. On the other hand, when one’s confidence ratings either exceed (overconfidence, positive values) or fall below (under confidence, negative values) their average correctness, metacognitive error is present. A second metric, calibration (C), goes beyond the average levels of confidence and correctness by comparing a student’s percent correct at each confidence level. A student who is well-calibrated is one whose confidence and correctness are closely aligned (e.g., always 10% correct when 10% confident and always 90% correct when 90% confident) whereas poor calibration is evidenced by misalignment across each level of confidence. The ideal value for calibration is also zero because this demonstrates strong alignment between average correctness and confidence at each confidence level. Resolution (R) is a third metric that generally describes the width of each student’s “confidence spectrum”: Students who always issue the same confidence judgement have poor resolution, whereas those who use many levels of confidence in their judgements have high resolution. The ideal value of one indicates the latter scenario (i.e., more is better).
The strength of computing and utilizing multiple metacognitive indices is that each index represents a different facet of a student’s metacognitive accuracy. For example, it is possible for a student with minimal error to have poor calibration. Imagine a student whose average confidence and correctness are both 50% (i.e., no error), but they achieve this through being 50% correct when 0% confident and 50% correct when 100% confident. This student is poorly calibrated because the discrete confidence levels do not align with the associated outcomes. Similarly, students who are steadfast in their self-assessment can possess zero error and be well-calibrated, yet have poor resolution by always issuing incorrect responses with 0% confidence and by issuing correct responses with 100% confidence. Thus, because each metric describes a different yet important aspect of a student’s metacognition, viewing all three indices together provides the most comprehensive picture of a student’s self-awareness. Each metric has an ideal value; therefore, tracking them over time can provide instructors a means of providing tangible feedback regarding the veracity of a student’s self-assessment. This feedback could then be used to explore how each individual student approaches a problem. For example, “I see you consistently underestimate your abilities. Why is that?” Tables 1-3 elaborate further on these concepts and contain examples of ideal and non-ideal values for each index.
 Table 1. The error index ranges between -1 and +1 and is derived by comparing the overall confidence and % correct. The light gray shading indicates the ideal value of 0. Click to enlarge |
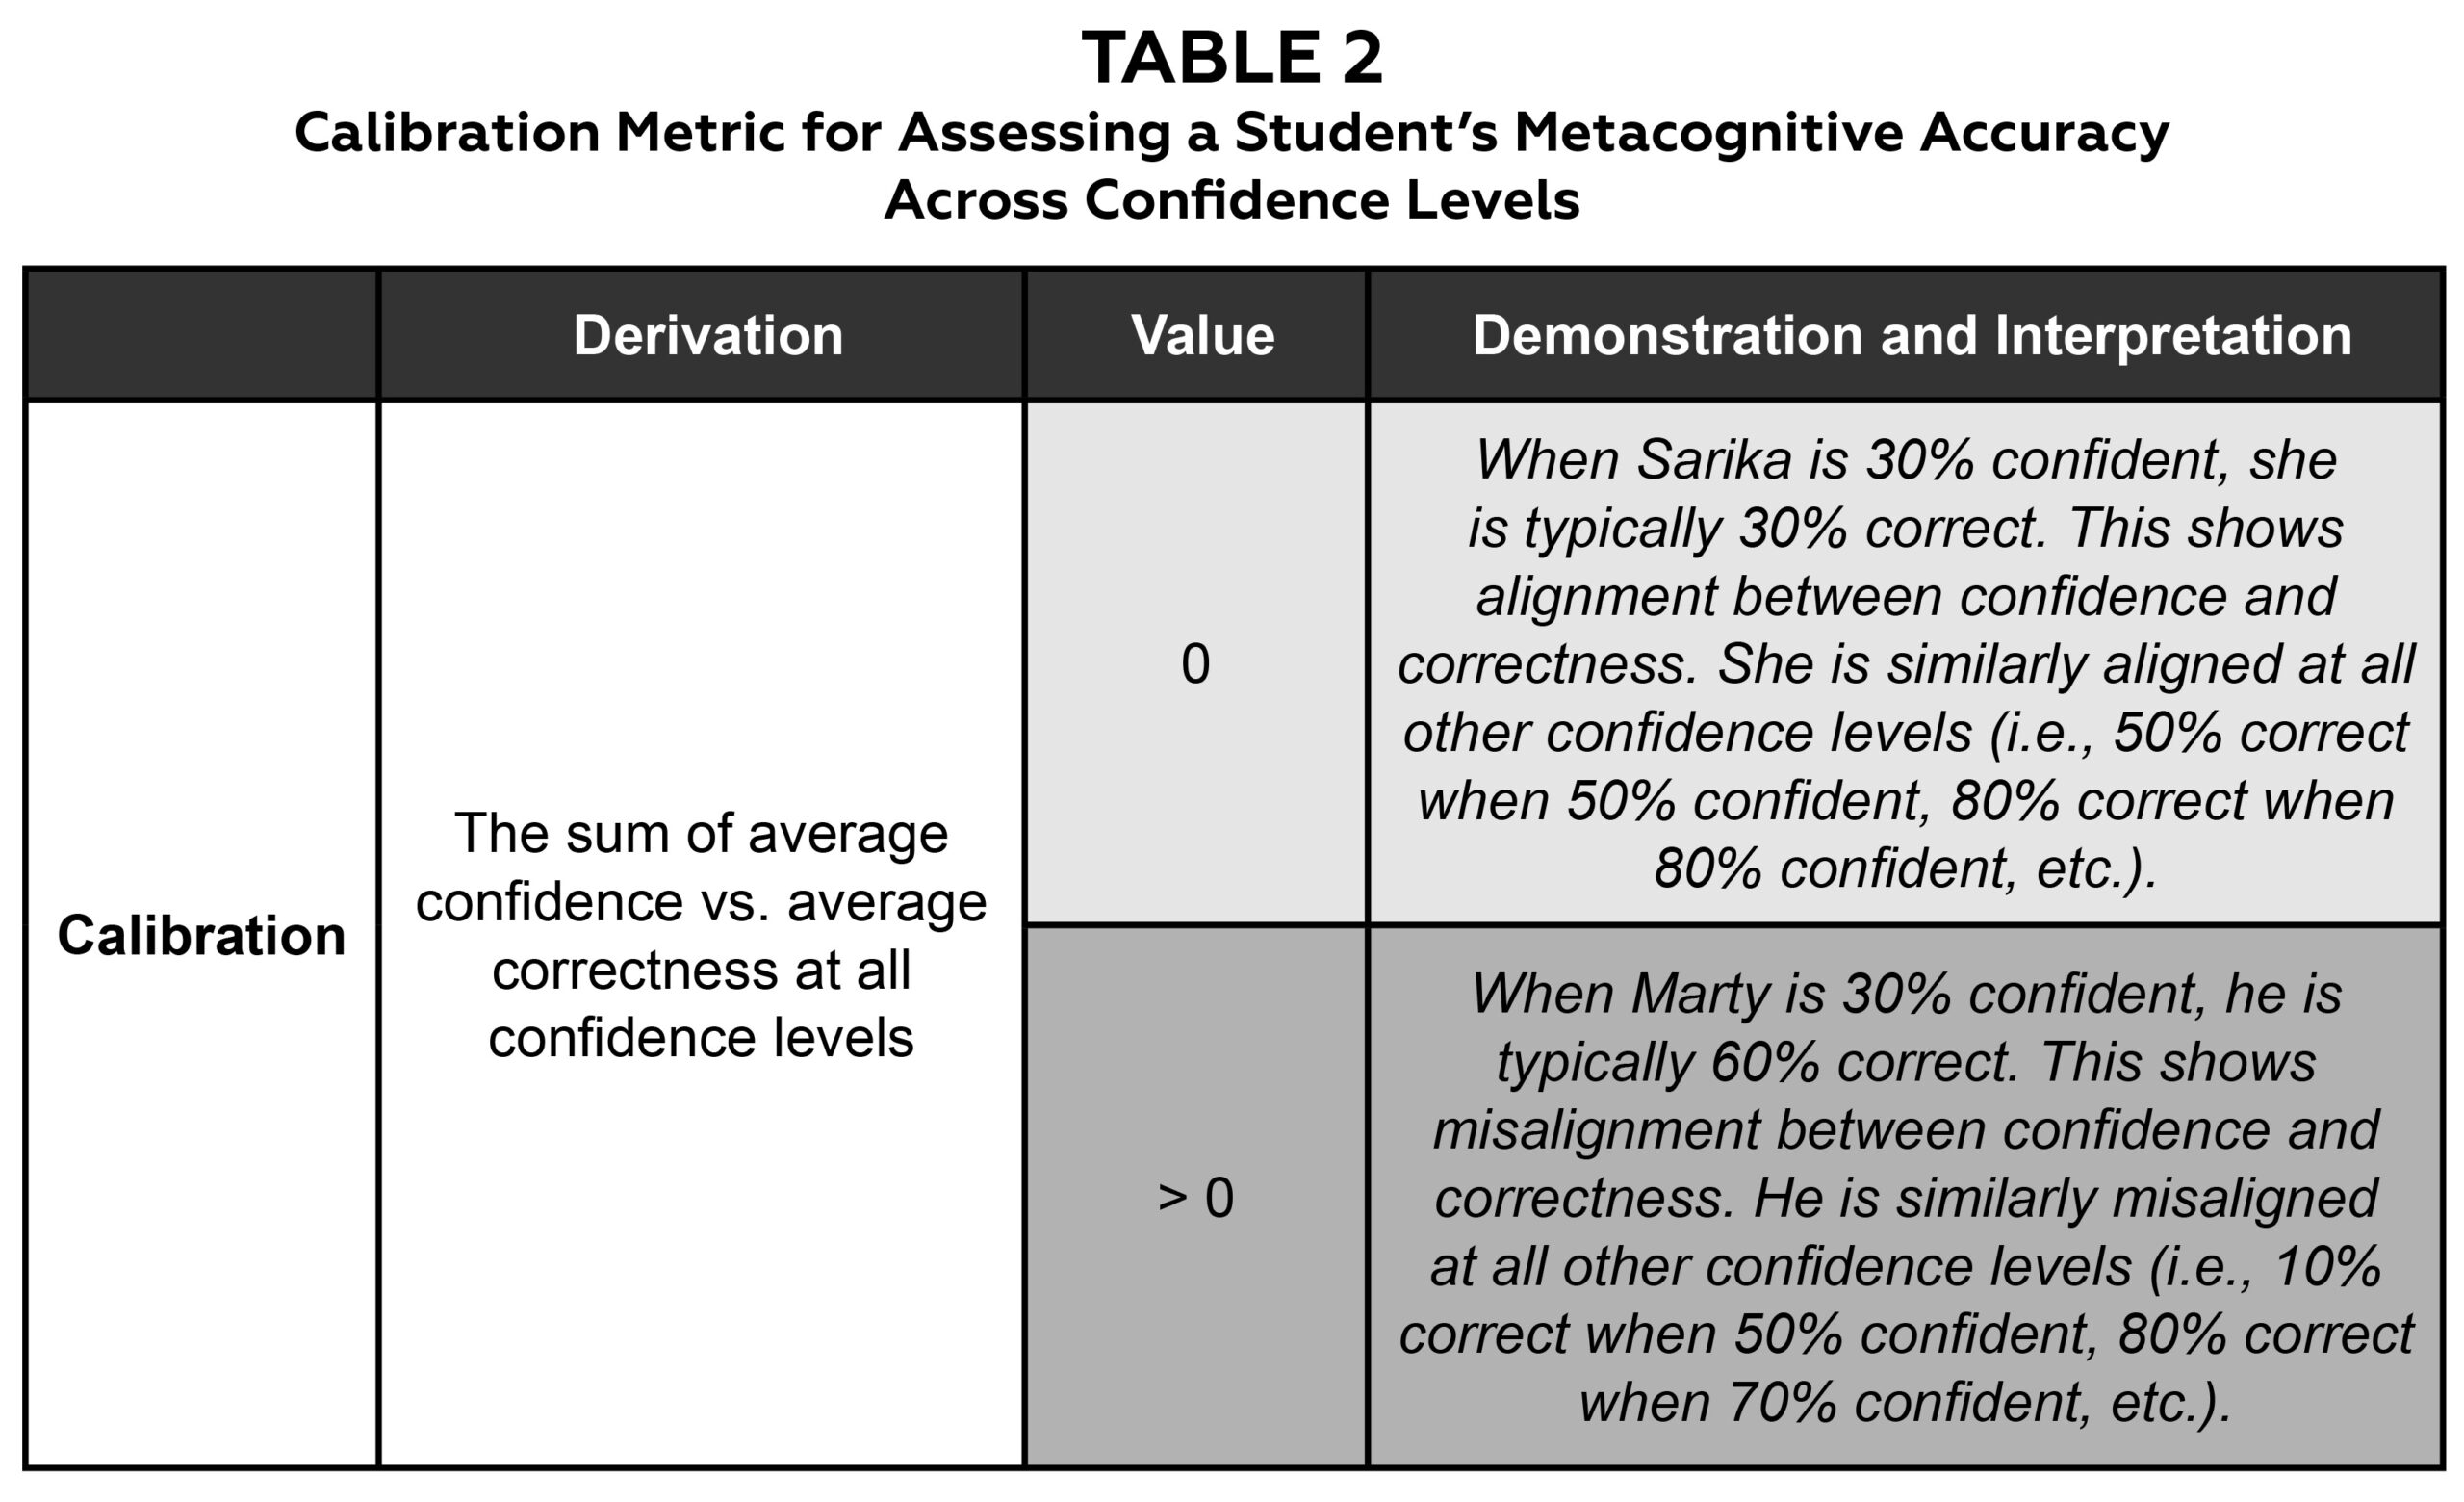 Table 2. The calibration index ranges between 0 and +1 and is derived by summing the discrepancy between average confidence and average correctness at all confidence levels (i.e., 0% through 100%). The light gray shading indicates the ideal value of 0. Click to enlarge |
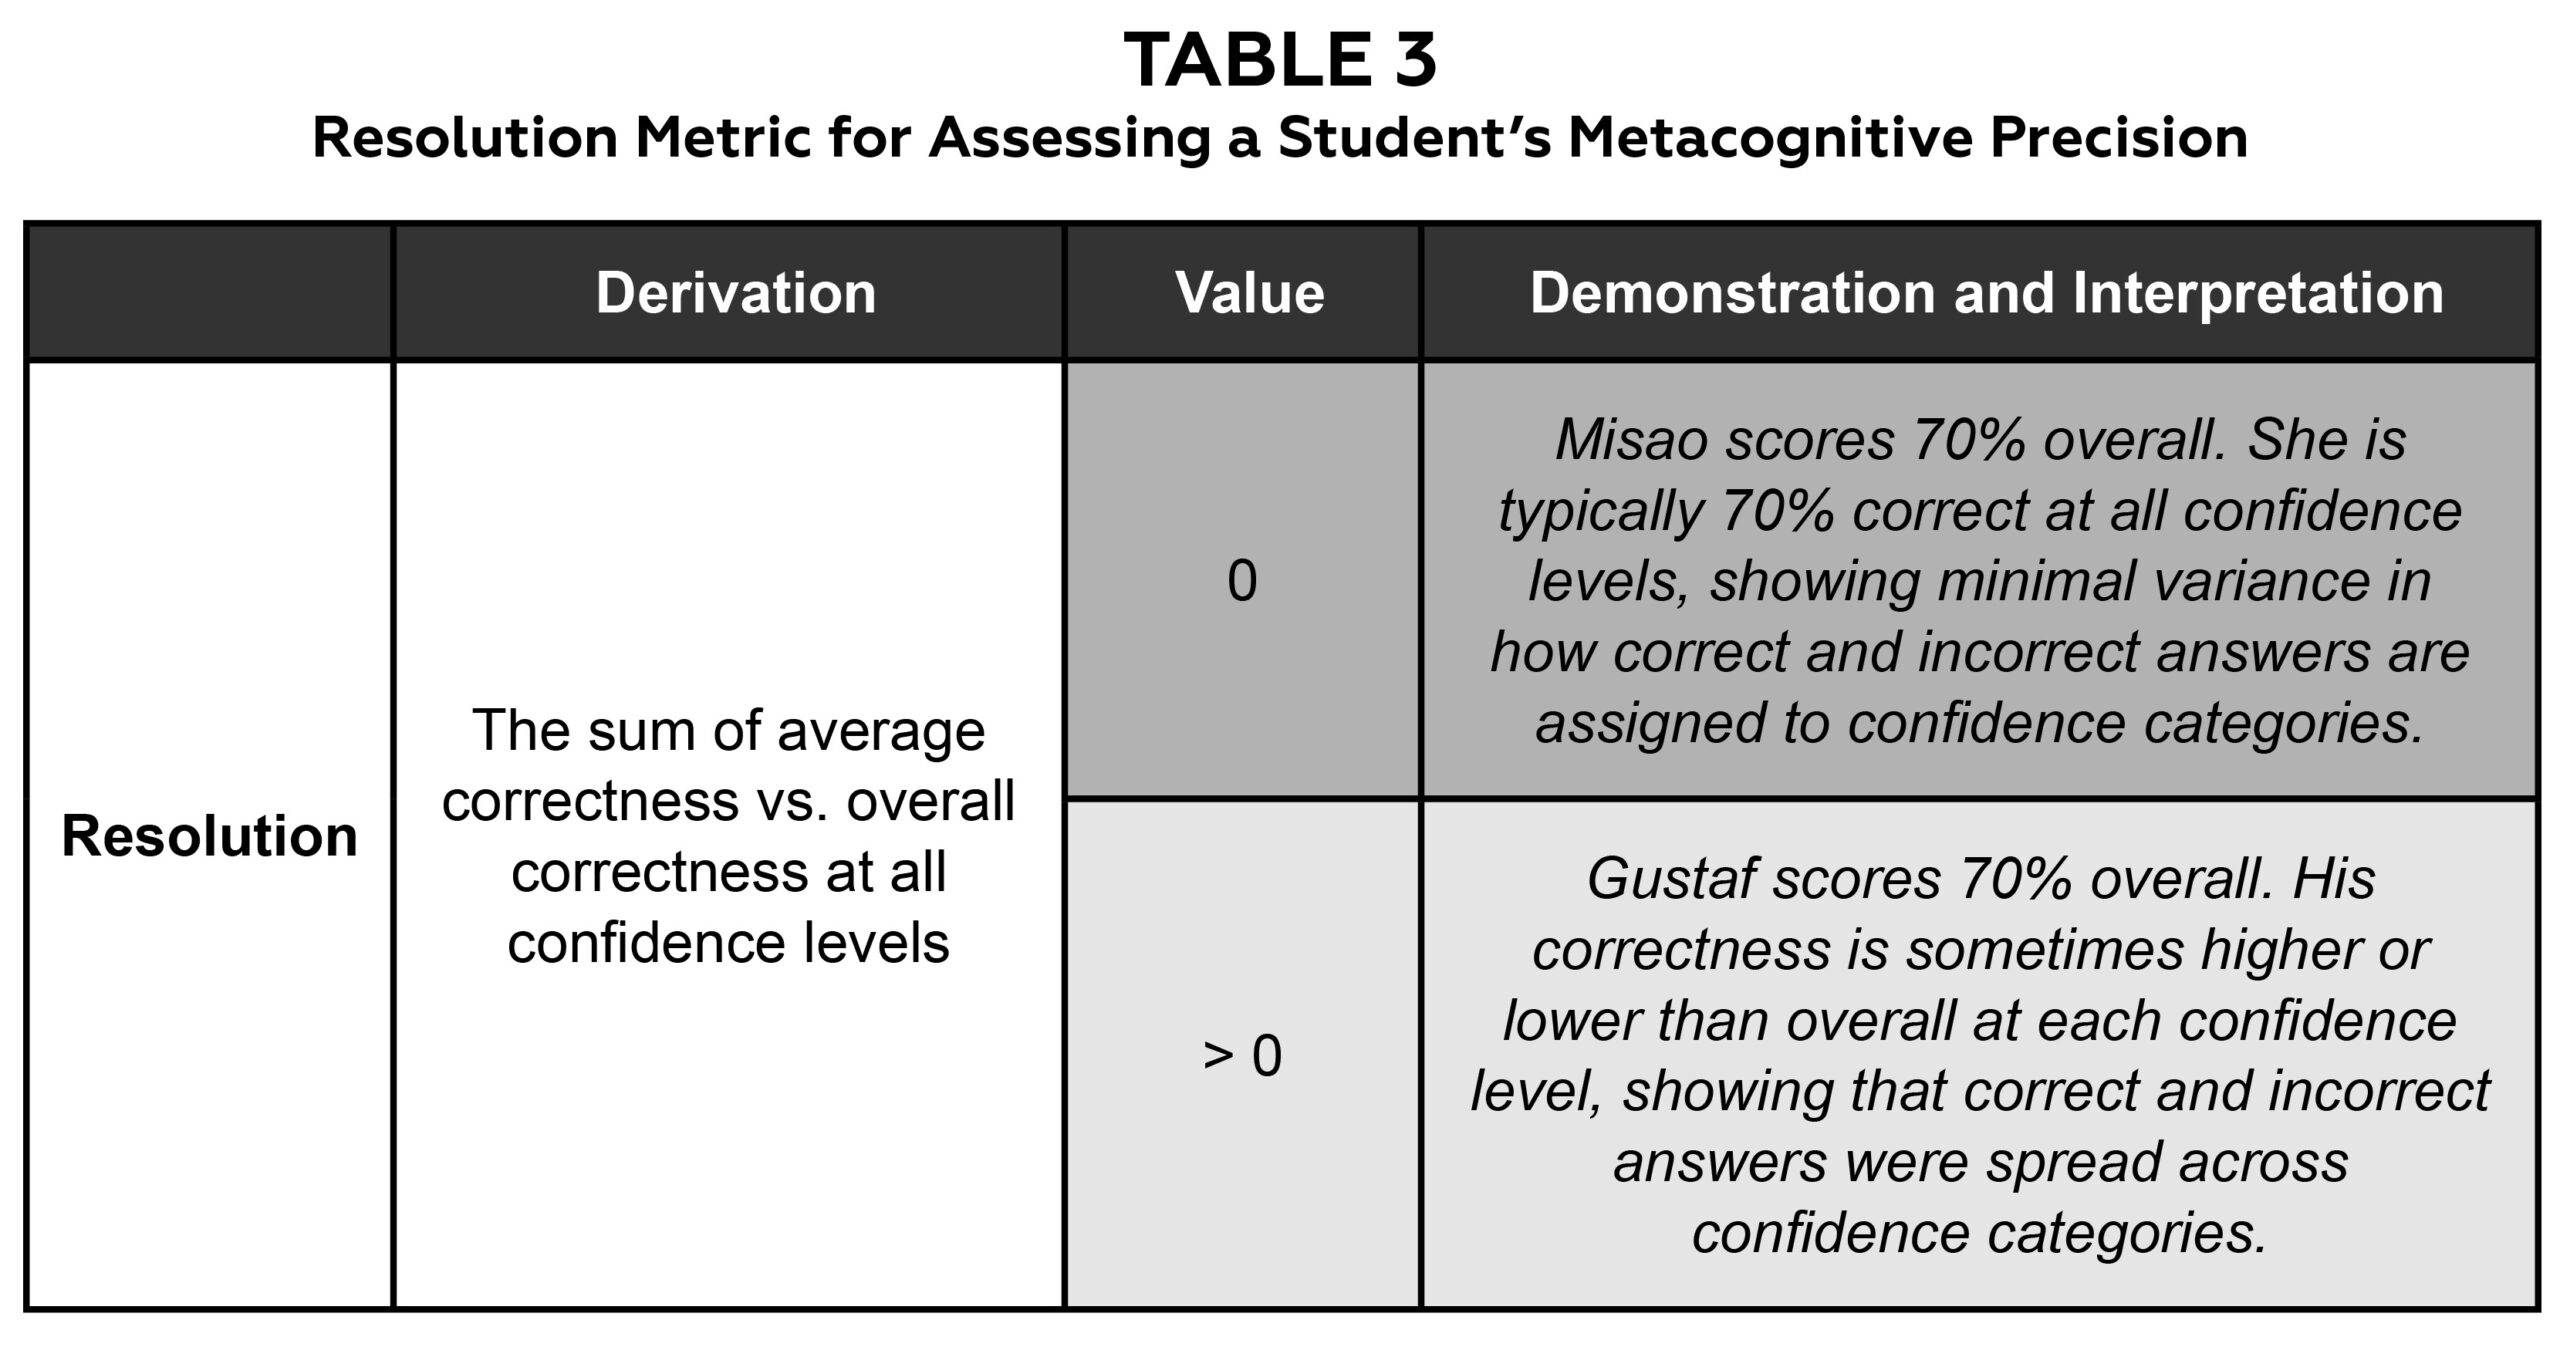 Table 3. The resolution index ranges between 0 and +1 and is derived by summing the discrepancy between average correctness and overall correctness at all confidence levels (i.e., 0% through 100%). The light gray shading indicates the ideal value of +1. Click to enlarge |
We were interested in determining if and how optometry students incorporate such feedback to change their metacognitive accuracy. Optometry students must develop the ability to accurately assess their thought processes because this skill is at the heart of optometric decision-making. Specifically, knowing their assessment of themselves is accurate allows students and practicing optometrists to take proper action after diagnostic (“I am confident this is bacterial; therefore …”) and therapeutic (“I am unsure how to treat this; therefore …”) decisions are made. Inaccurate self-assessments have less desirable outcomes (e.g., incorrect diagnoses and/or unnecessary referrals). It is unclear whether optometry students typically possess accurate metacognition and, if so, whether it can be improved over time. Therefore, we designed a teaching intervention to answer these two questions with the ultimate goal of determining whether directly teaching metacognitive accuracy would be beneficial in optometric curricula.
Methods
Teaching intervention
The investigation was conducted as a teaching intervention within the Board Preparation course (OPT 7999) at Nova Southeastern University College of Optometry. Corresponding author KTW served as the instructor of record (IOR). The OPT 7999 course was held for 6 weeks during the beginning of the winter semester and was graded on a pass/fail basis. The primary goal of the course was to prepare students for Part I of the National Board of Examiners in Optometry (NBEO) examination. The class activities were designed to review content and practice self-assessment. Passing grades were given to all students who completed the class assignments described below in Procedures. This was the first time the course was taught with this structure.
Participants
Eighty-eight third-year students from the College of Optometry participated in the investigation. The sole inclusion criterion was enrollment in the course: All students in the third-year class were eligible to participate because OPT 7999 is mandatory. There were no exclusion criteria set forth; however, each student was required to take part in an informed consent discussion on the first day of class and then issue their written consent if interested and willing to participate in the teaching intervention. A total of 15 students chose not to participate or did not upload their workbooks at the conclusion of the semester. Three students were absent during the first week of class. We included them in all analyses except those that compared the first and last weeks of the course. We treated all 88 participating students as a single cohort in our subsequent analyses because each of them had taken the same courses and examinations throughout their time in the professional program.
Procedures
The following procedures and analyses are graphically and verbally summarized in Figure 1 and Table 4, respectively. Each of the six class sessions lasted for approximately an hour and consisted of 20 sequential multiple-choice questions. The multiple-choice questions were derived from both optometric faculty members’ courses and from Butterworth-Heinemann’s Review Questions for the NBEO: Part One.5 The questions spanned multiple optometric content areas including anatomy, biochemistry, immunology, pathology, optics and pharmacology. Each item had a total of four possible answers (i.e., A, B, C or D) with a time limit of 1.5 minutes imposed. The sequence of each session’s questions was chosen by the IOR to equivalently cover each of the content areas during each session. Each session thus contained a mixture of optometric content and did not explicitly focus on one area from week to week.
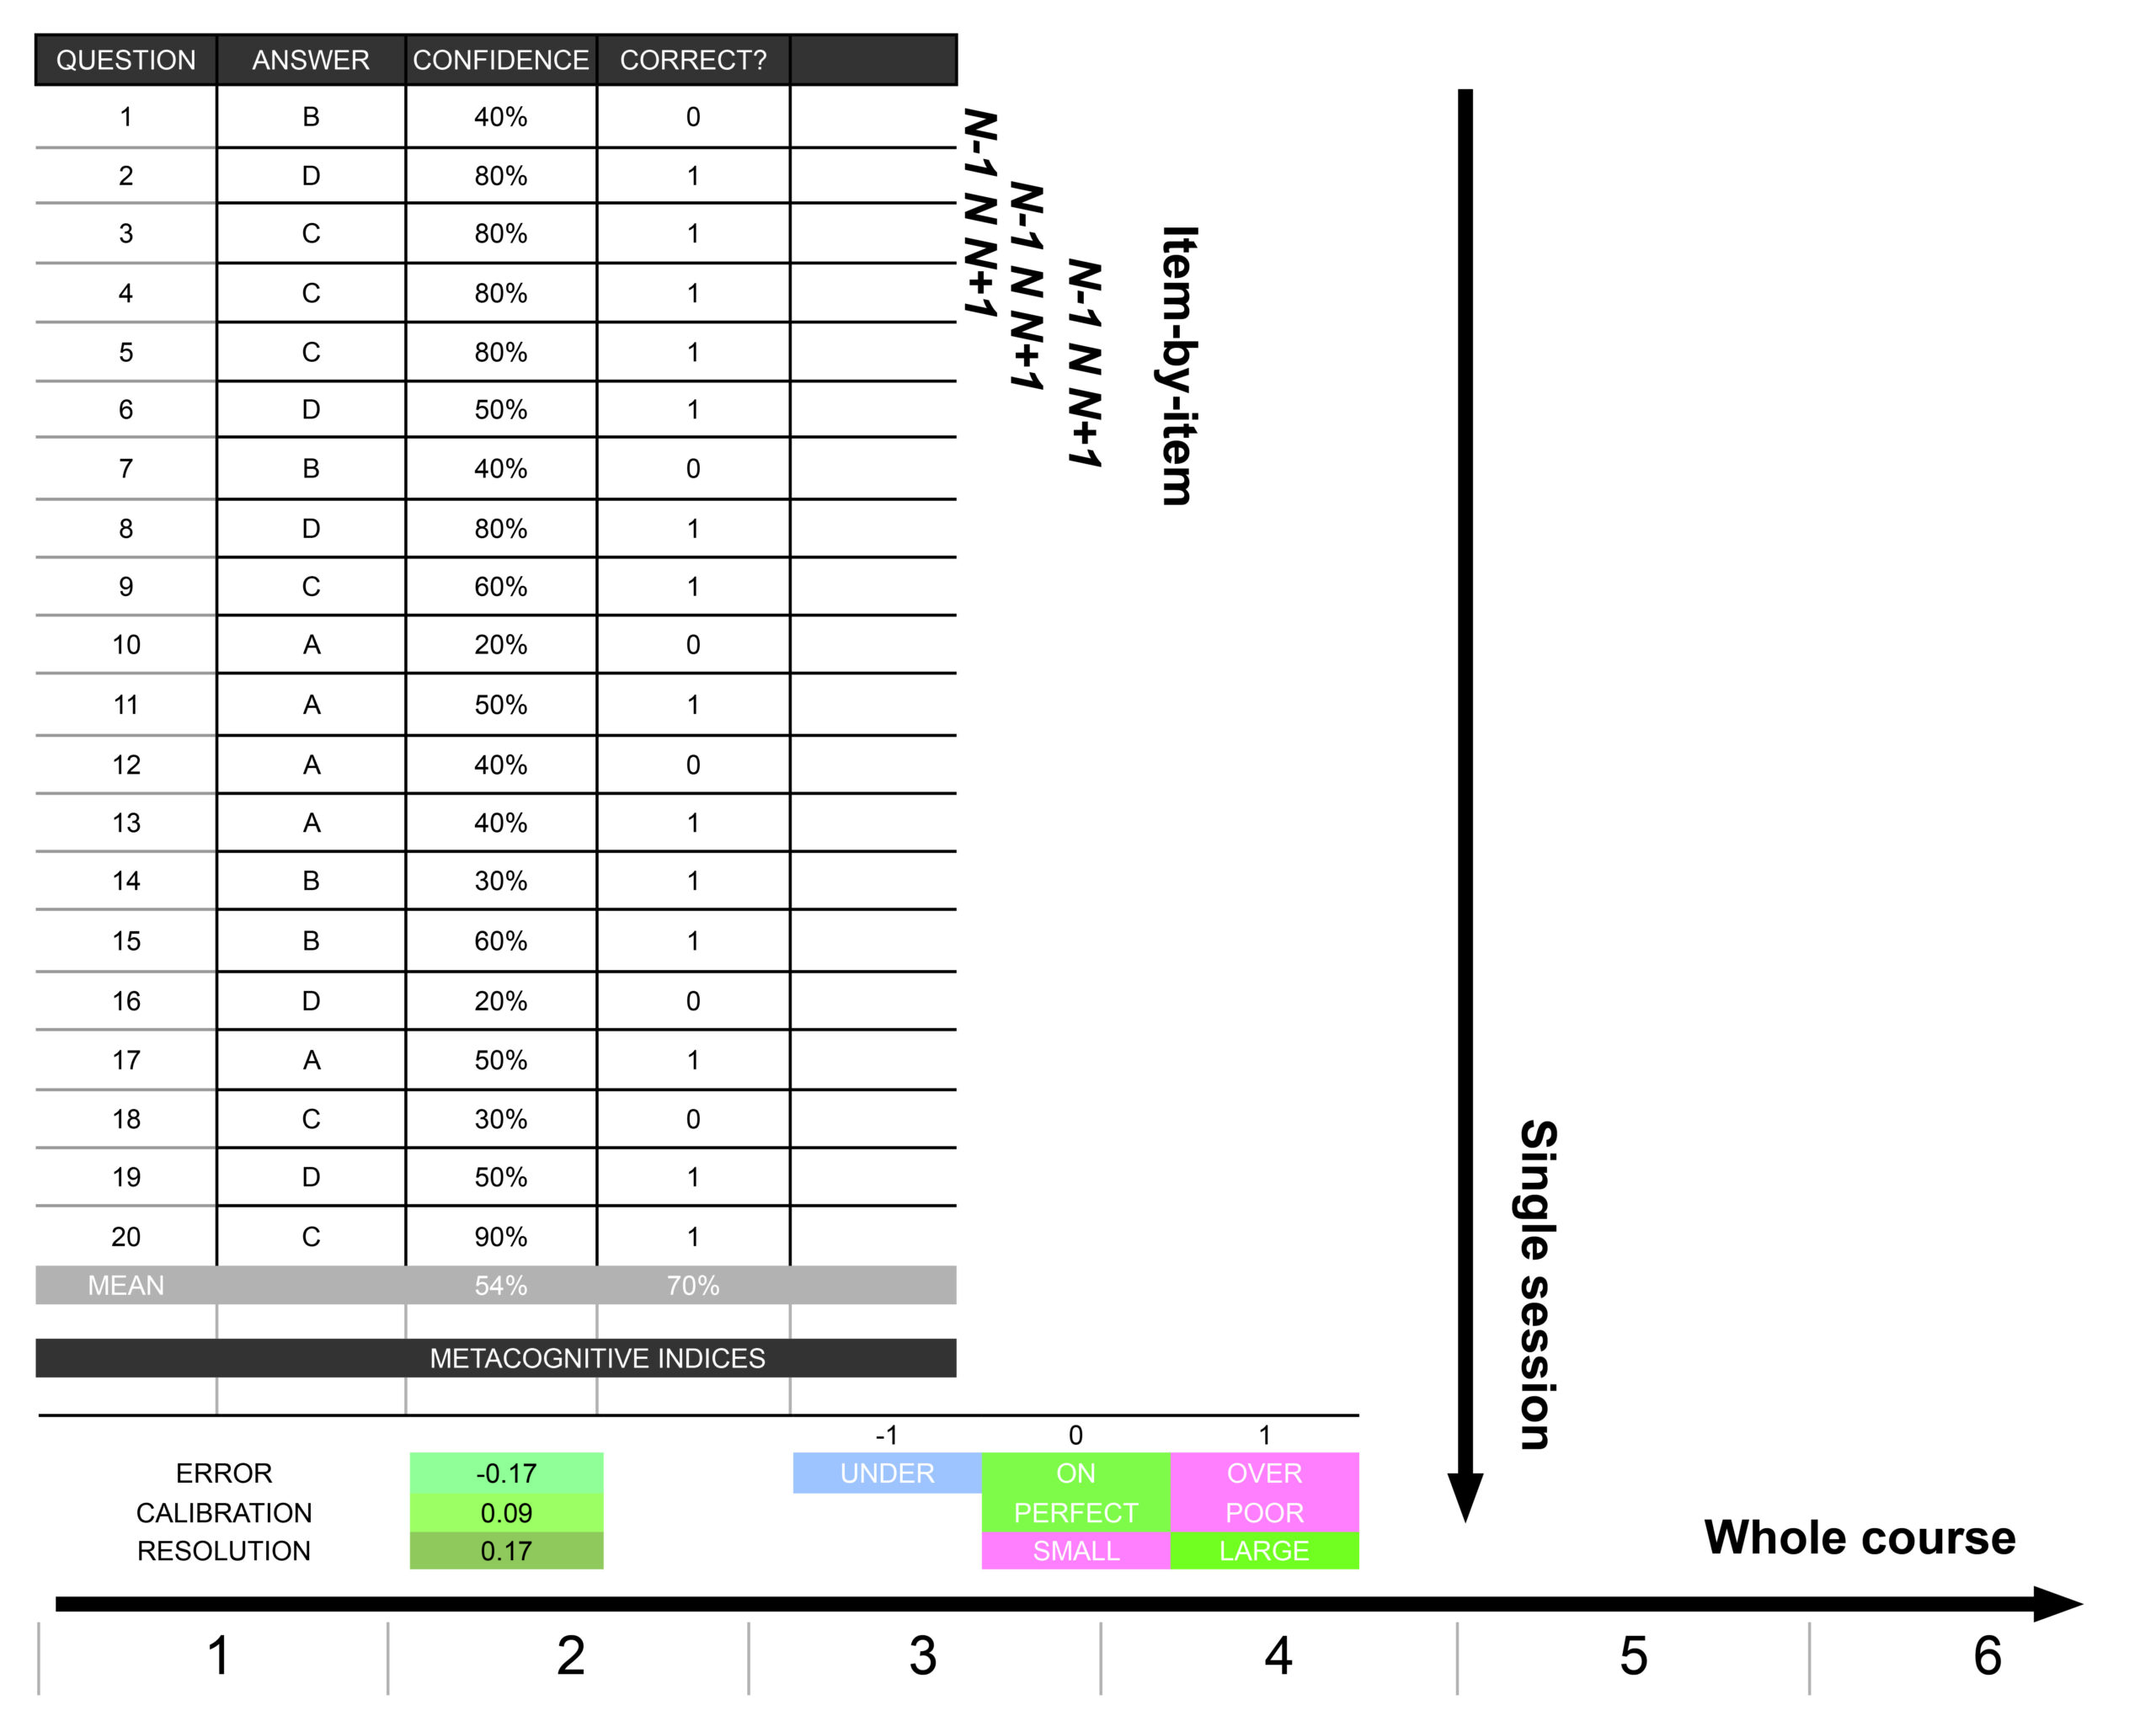 Figure 1. Excel workbook used to enter and track each session’s judgements and metrics. Each student answered 20 items each week (“answer”), issued a probabilistic confidence judgement (“confidence”) and subsequently marked whether they were correct (1) or not (0). The confidence judgements and outcomes from each item were analyzed relative to the preceding and following items (“item-by-item”), throughout a “single session” or across the “whole course.” Click to enlarge |
 Table 4. Each temporal scale requires a different pattern of data amalgamation. The item-by-item analysis (first row) preserved the relative sequence, but not absolute number, of each item. The single session (second row) and whole course (third row) analyses both preserved student identity while segregating responses by either the absolute number of each item (single session) or of each session (whole course). |
An introductory lecture given before the course began introduced the structure of the course and related teaching intervention. The concept of metacognition and the indices to be used were introduced with the Excel workbook and lecture slides serving as demonstrative illustrations. Then, during the course, feedback regarding metacognitive accuracy was made available to each student over different time scales. First, after answering a question, each student was instructed to issue a confidence rating reflecting their probabilistic assessment (0% to 100% in 10% intervals) that their answer was correct. Then, upon the correct answer being revealed, each student marked whether their answer was incorrect or correct. This revelation of correctness, in conjunction with the associated confidence rating, served as an immediate form of feedback regarding the student’s metacognitive accuracy on the given item. Second, the three metacognitive indices of error, calibration and resolution were calculated at the end of each session and made available for each student to view. This form of feedback was included to help each student evaluate their metacognitive accuracy for each class session. Last, because each student had access to each of the six sessions’ metacognitive indices, they were also able to track how their metacognitive accuracy changed throughout the course.
The answers, confidence judgements and correctness were all recorded in an excel workbook provided to the students (Figure 1, left). Students entered each of the six sessions’ data on dedicated weekly sheets labeled as 1, 2, 3, etc. Each student’s average confidence, average correctness and the three metacognitive indices (i.e., E, C and R) were visible at the bottom of each week’s sheet and computed “live” as the students continued to answer each of the session’s questions. The average metrics were finalized once all 20 questions had been answered. Color scales were used to help students visualize the meaning of each metacognitive index: green indicated “ideal” metacognition, red indicated “poor” metacognition, and blue indicated under confidence for the error metric alone. These colors were based on the ideal values of each metric (i.e., zero, zero and one). Excel interpolated between each of these colors to generate a colored cell, which showed each student where they fell on the metacognitive accuracy spectrum (Figure 1, bottom). For example, pure blue, pure green and pure red represented values of -1.0, 0.0 and +1.0 for the error metric. In Figure 1, the student’s actual error of -0.17 is illustrated by a unique color that fell between pure blue and pure green on the color scale. Similarly, colors that fell between pure green and pure red (C = 0.09) and pure red and pure green (R = 0.17) were used to illustrate their calibration and resolution.
Analyses
The confidence judgements and associated correctness outcomes from all items, sessions and students were analyzed on three different time scales related to the delivery of feedback: item-by-item, single session and whole course. This was done to determine whether providing feedback regarding metacognitive accuracy can change metacognitive accuracy itself over short, medium or long periods of time. A total of 10,500 items (88 students answering 20 items per each of the six sessions, with three students missing in the first week) were included in the subsequent analyses.
Item-by-item
The item-by-item time scale represents the ~ 1.5-minute interval between successive items. The question at the heart of this analysis is “does knowing my metacognitive accuracy on the current item influence my metacognitive accuracy on the next?” In other words, if I know my judgement and outcome were just aligned, will this lead me to be similarly accurate on the next item? We determined whether the metacognitive accuracy exhibited on the current question (N) was associated with the preceding (N-1) or following (N+1) metacognitive accuracies in the following manner. First, we labeled all items as “uninformed,” “misinformed,” “partially informed” or “well-informed” using binary classifications of both confidence level and correctness. The metacognitive accuracy categories were labeled as originally proposed by Hunt:6
- Uninformed if the item was incorrect and their confidence was < 50%
- Misinformed if the item was incorrect and their confidence was ≥ 50%
- Partially informed if the item was correct and their confidence was < 50%
- Well-informed if the item was correct and their confidence was ≥ 50%
Second, we computed the proportion of each category that tended to precede or follow each specific category for all possible items. For example, for items identified as uninformed, we checked the collection of categories for all preceding questions (N-1) and computed the percentage of preceding items labeled as uninformed, misinformed, partially informed or well-informed. Then, continuing, we computed the proportion of categories present on all items following uninformed items (N+1). This procedure was repeated for each of the remaining categories (i.e., the proportions of categories for items preceding or following items labeled as misinformed, partially informed and well-informed). This comparison of preceding and following proportions was done without respect to the actual item number, the session number or student identity (Table 1, first row). A total of 9,486 items were included in this analysis because the first and 20th items did not have any items preceding or following them, respectively.
The symmetry of the N-1 or N+1 distributions indicates whether metacognitive accuracy tended to fluctuate or stay the same across items. Symmetric distributions (i.e., the same proportion of each category) would suggest that metacognitive accuracy fluctuated because any of the four metacognitive accuracy categories was just as likely to occur before or after a given category (e.g., an equal chance of being uninformed, misinformed, partially informed or well-informed before uninformed items). On the other hand, asymmetric distributions would suggest that metacognitive accuracy tended to stay the same (e.g., uninformed items tend to precede and follow other uninformed items). We quantified this notion of symmetry by performing a Fisher’s exact test on the proportion of categories both preceding and following uninformed, misinformed, partially informed and well-informed items. This statistical test determines whether one of the categories tended to occur more often than the others: An odds ratio significantly greater or less than one suggests the distribution of proportions is uneven.
Single session
This time scale represents the ~ 1-hour interval between the first and last questions in a session. Analysis at this level asks: “can receiving continual feedback throughout a session change my metacognitive accuracy?” We determined whether metacognitive accuracy tended to change throughout a session in the following manner. First, we pooled the responses from all sessions to create a distribution of six judgements and associated outcomes for each of the 20 items for each student. Thus, because student identity was preserved, there was a distribution of 88 values describing the error, calibration or resolution for each of the 20 items across all sessions (Table 1, second row). Error, calibration and resolution were computed using the formulas described by Fleming et al.: All compare different facets of confidence ratings and performance outcomes and are derived from the extant metacognitive literature.1
The difference between the indices derived from the 20th vs. first items was used to compute three additional variables (∆EI, ∆CI and ∆RI) representing the direction and magnitude of metacognitive change between the beginning and end of a session. For ∆EI, a positive difference represents a trend toward either no error or overconfidence. Negative ∆CI values indicate calibration has improved throughout a session, whereas positive ∆RI values indicate resolution has improved during class. We planned a two-sided t-test to determine whether the collection of ∆EI, ∆CI or ∆RI values were significantly different from zero. We chose a two-sided t-test because we did not know the direction in which metacognitive accuracy would shift for any of the metrics.
Whole course
This time scale represents the interval between the first and last sessions of the course. Analysis at this level asks: “can receiving continual feedback throughout a course change my metacognitive accuracy?” We addressed this question in the following manner. First, we pooled responses from all items to create a distribution of 20 judgements and associated outcomes for each of the six sessions for all students. This was also done for each student; therefore, there was a distribution of 85 of each of the metacognitive indices that summarized our cohort’s metacognitive accuracy for each of the six sessions (Table 1, third row).
The difference between the indices derived from the sixth vs. first sessions was then used to compute three additional variables (∆ES, ∆CS and ∆RS) representing the direction and magnitude of metacognitive change between the beginning and end of the course. These variables have the same sign convention as the difference variables mentioned previously, and as for the single session analysis, we also planned a two-sided t-test to determine whether the collection of ∆ES, ∆CS or ∆RS values were significantly different from zero.
Results
Item-by-item
Figure 2 displays two important findings revealed in our item-by-item analysis. First, the proportion of metacognitive accuracy categories was overall asymmetric: Most items were labeled as well-informed. There were a total of 3,345 (36%) items labeled as well-informed, 2,849 (30%) labeled as uninformed, 2,314 (24%) labeled as partially informed, and 996 (10%) labeled as misinformed. This suggests that most items were evaluated with metacognitive accuracy. Items answered with high confidence ended up being correct, and items issued with low confidence ended up being wrong.
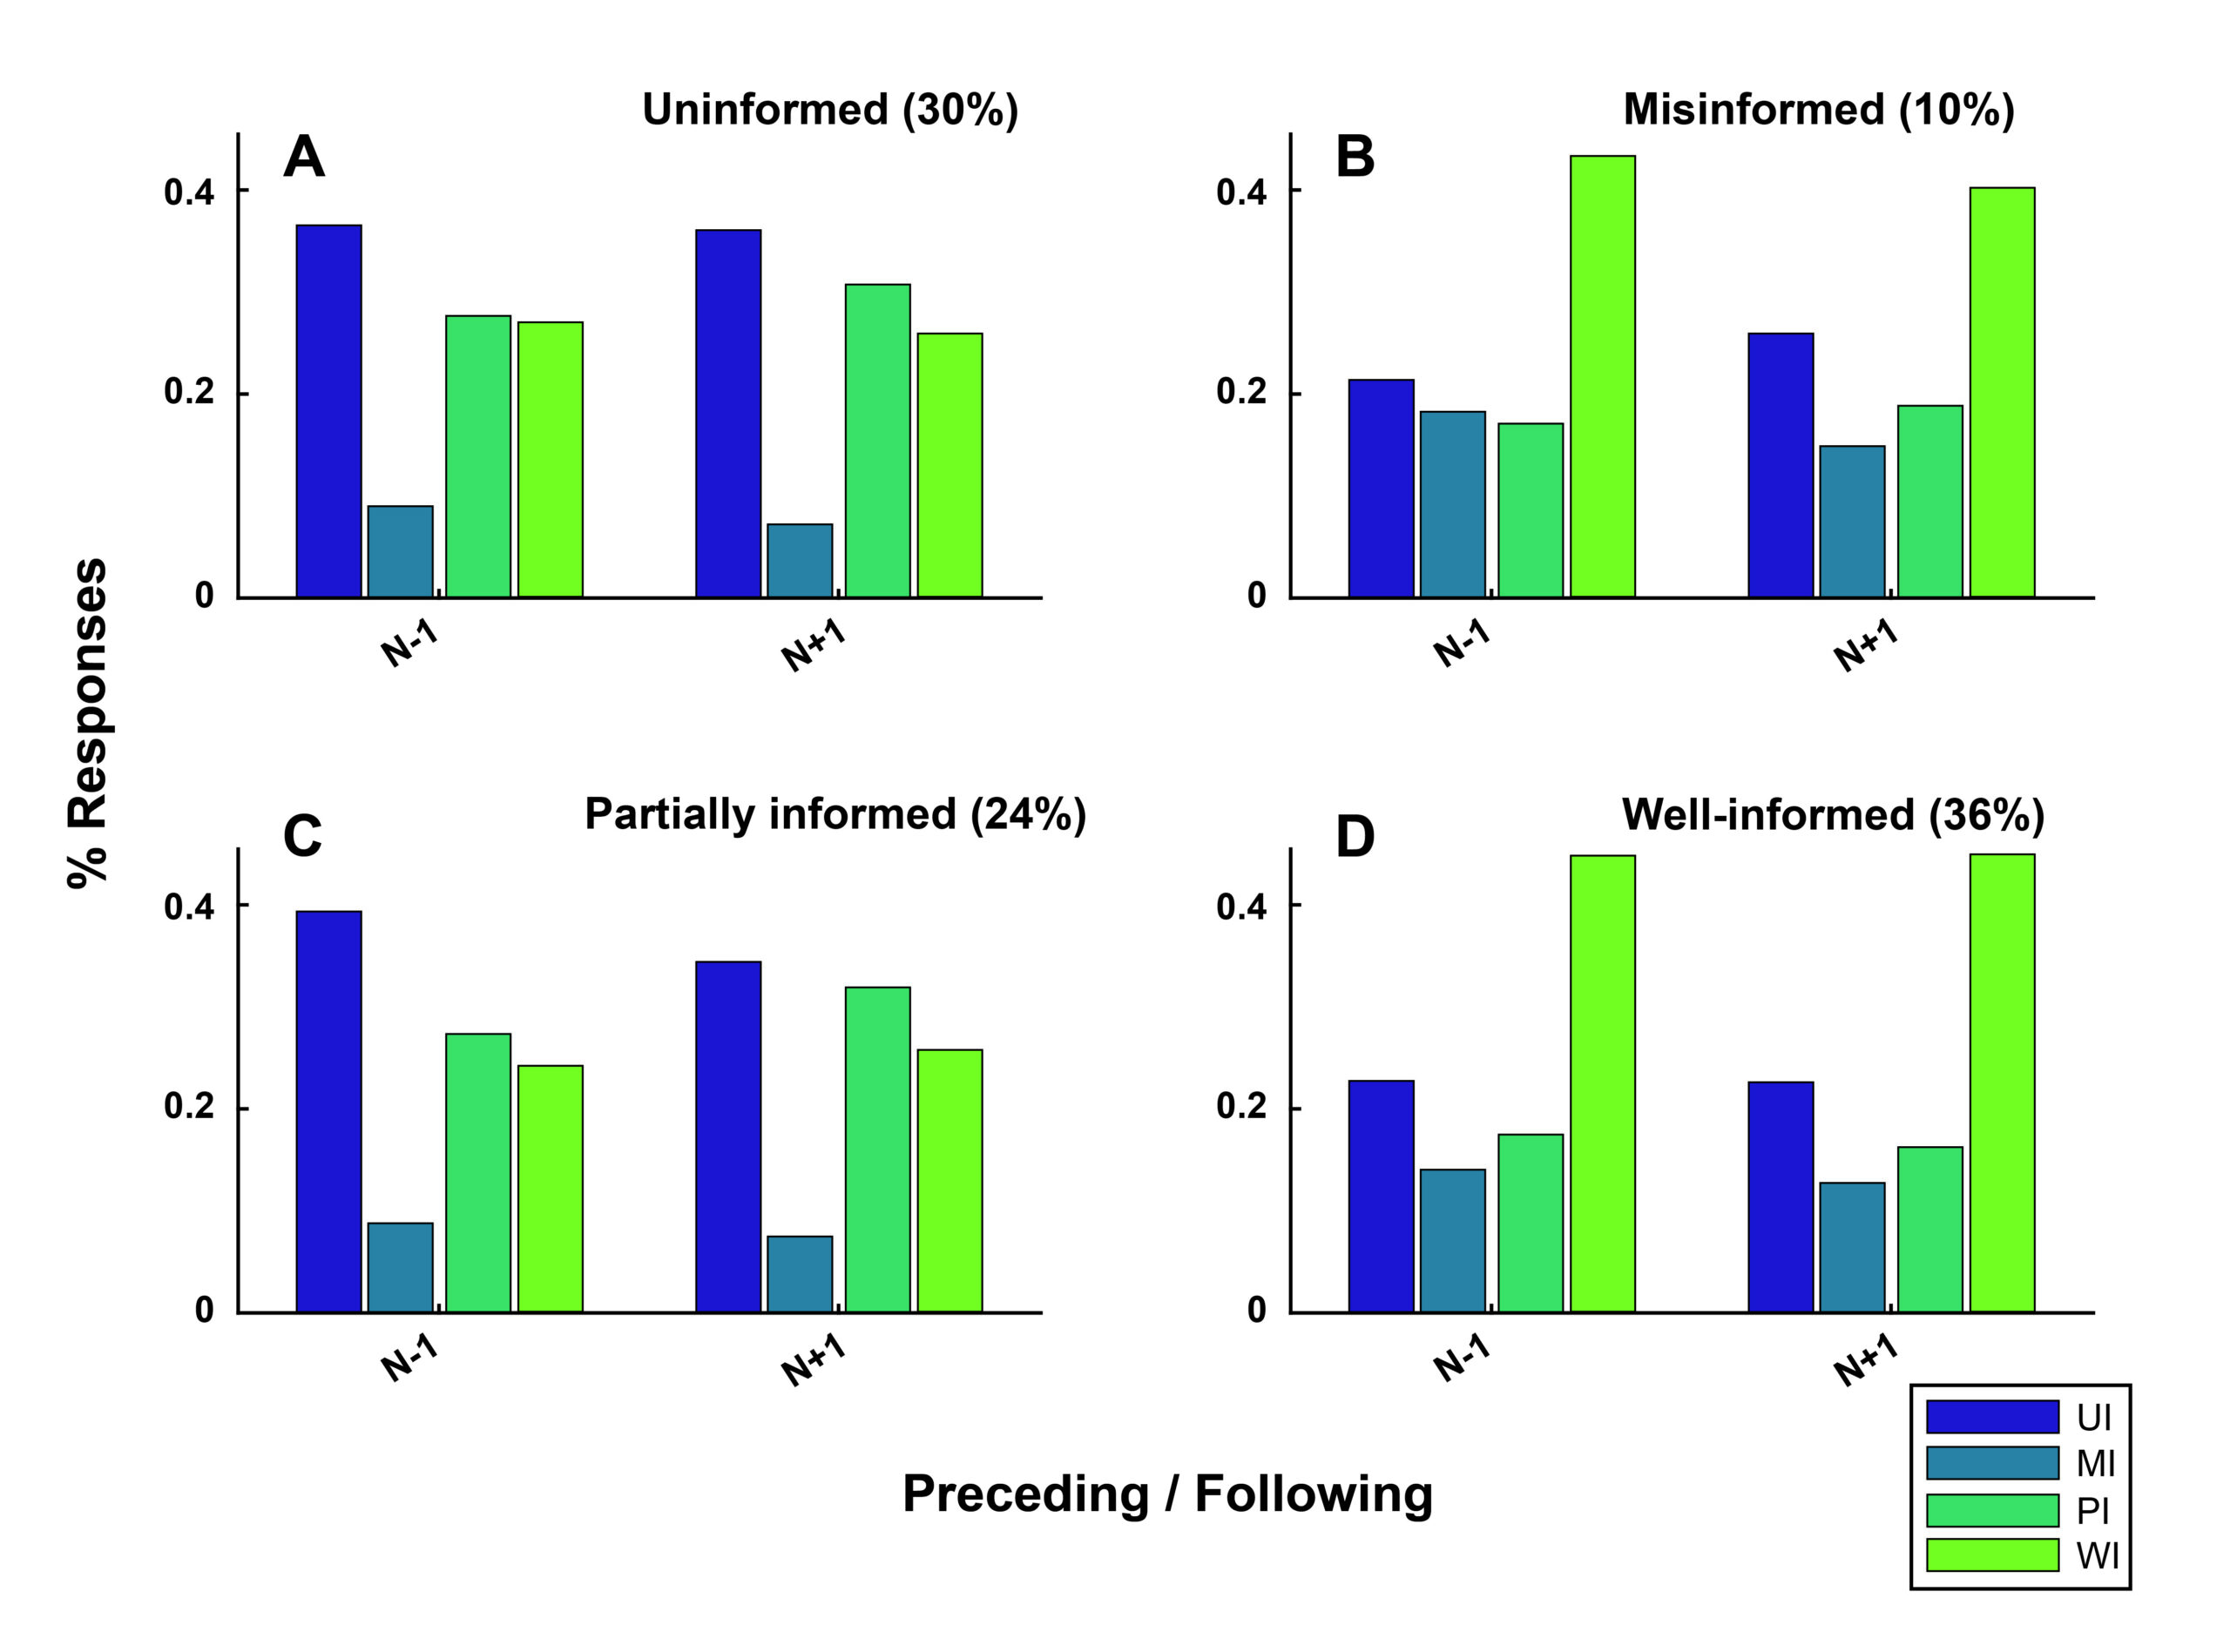 Figure 2. Confidence remains static across short time scales. Low confidence responses (A, C) were most likely to be preceded and followed by low confidence responses, whereas high confidence responses (B, D) tended to be followed by high confidence responses. The gray text shows the metacognitive accuracy category for the current item analyzed (N) and the percentage shows the total proportion of items with that label. The colored bars in each panel show the proportion of each category preceding (N-1) and following (N+1) the current item. Click to enlarge |
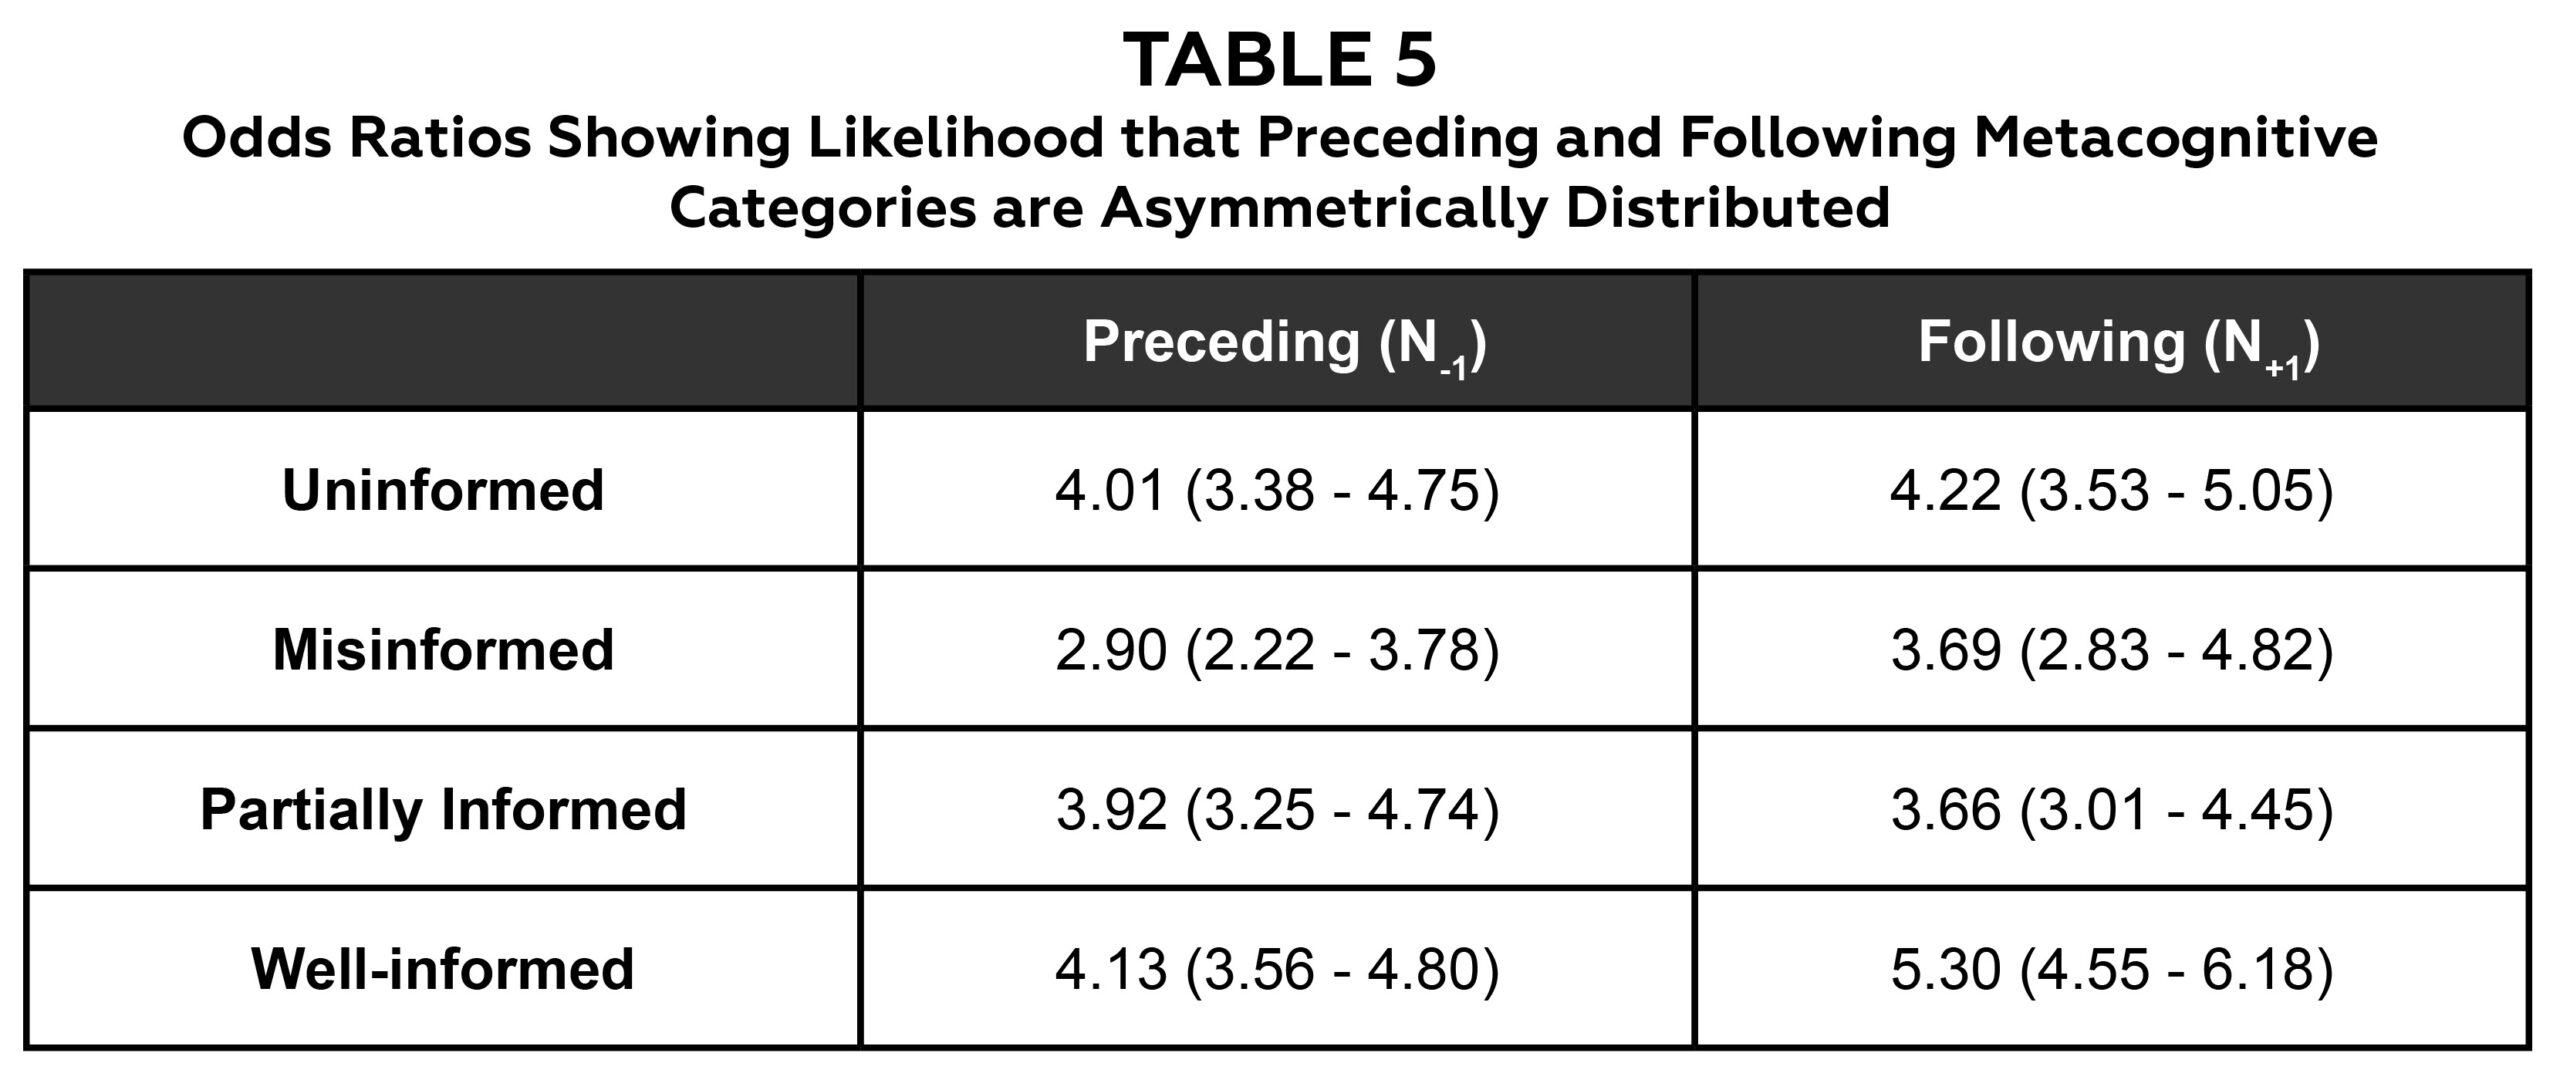 Table 5. The proportion of metacognitive accuracy categories preceding and following a particular category are asymmetrically distributed. Each row contains odds ratios describing the likelihood that a relationship between confidence and correctness exists for both the preceding and following proportions of categorizations. Click to enlarge |
Second, confidence ratings tended to remain similar across temporally adjacent item. Low confidence judgements tended to be preceded and followed by low confidence judgements, and high confidence judgements tended to be preceded and followed by high confidence judgements. For example, Figure 2A illustrates that items categorized as uninformed were most likely to be both preceded and followed by uninformed responses. Similarly, Figure 2C shows that partially informed items were most likely to be both preceded and followed by either uninformed or partially informed items. Both uninformed and partially informed responses are issued with low confidence; therefore, the predominance of these categorizations surrounding items with a similar category suggest a temporal stasis of confidence was sometimes operative. The same “hysteresis” of confidence was seen for high confidence items. Both misinformed and well-informed items tended to be followed by items categorized as well-informed. Fisher’s exact test confirmed the presence of asymmetric distributions: The odds ratios computed for each of the eight collections of N-1 and N+1 proportions were significantly greater than one (Table 5).
Single session
Figure 3 shows how our three metacognitive indices of error (EI), calibration (CI) and resolution (RI) changed throughout a session. The value of each index tended to fluctuate as a session progressed. This is evidenced by the “jagged” nature apparent in each of the graphs. The mean error at the beginning of a session (i.e., for the first item) was -0.084 and changed to -0.167 by the end. The mean initial calibration for our cohort increased from 0.007 to 0.009 between the first and 20th items, whereas the mean initial and final resolutions were both approximately 0.01. The t-test confirmed that both the ∆EI and ∆CI distributions were significantly different from zero: ∆EI values fell between -0.080 and -0.085, whereas ∆CI values ranged between 0.016 and 0.018.
Whole course
The three metacognitive indices also appeared to fluctuate throughout the course (Figure 4). The mean error at the beginning of the course (i.e., for the first session) was -0.090 and changed to -0.18 by the end. Calibration for our cohort remained constant between the beginning (0.105) and end (0.120) of the course, whereas resolution appeared to increase from a mean of 0.127 at the outset of the course to a mean of 0.147 at the end. The t-test confirmed that both the ∆ES and ∆RS distributions were significantly different from zero: ∆ES values fell between -0.089 and -0.085, whereas ∆RS values ranged between 0.017 and 0.019.
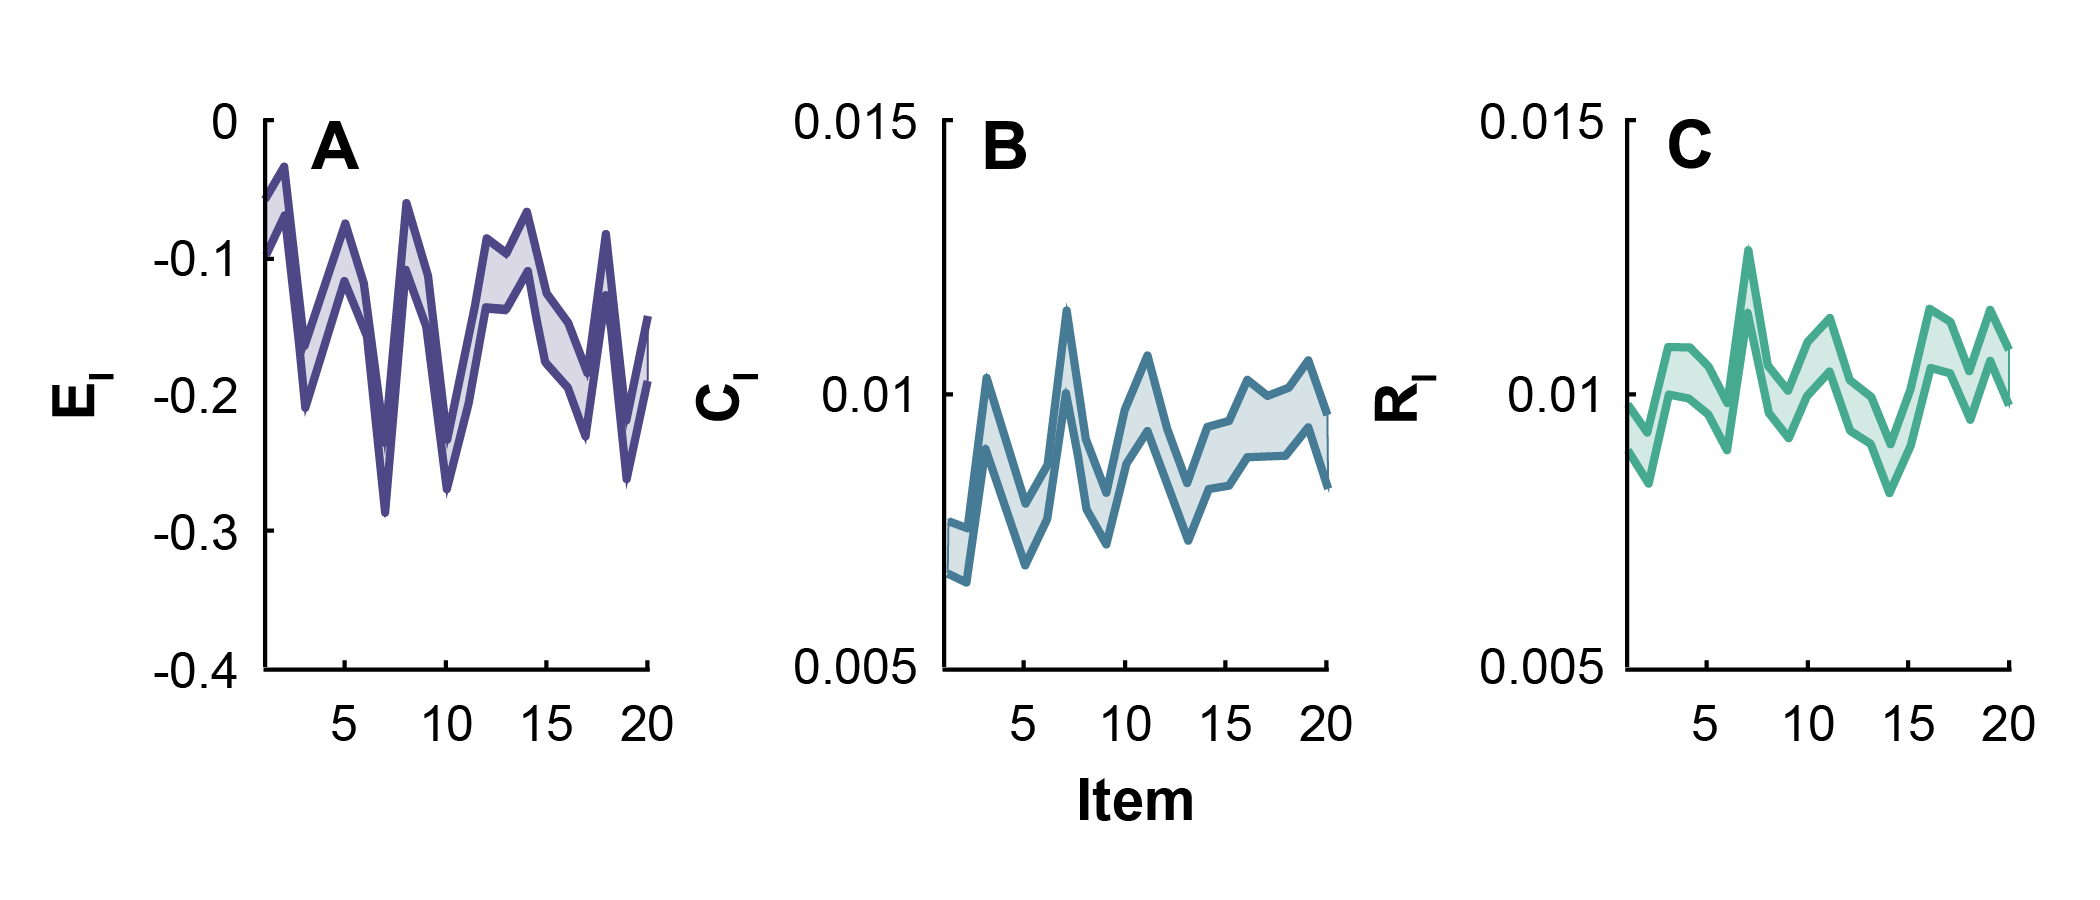 Figure 3. Error and calibration change throughout single sessions. The average error value tended to decrease (A), calibration values tended to increase (B), and resolution values tended to stay the same (C) throughout a class session. Each shaded bar represents the mean +/- 1 standard error of the mean. Click to enlarge |
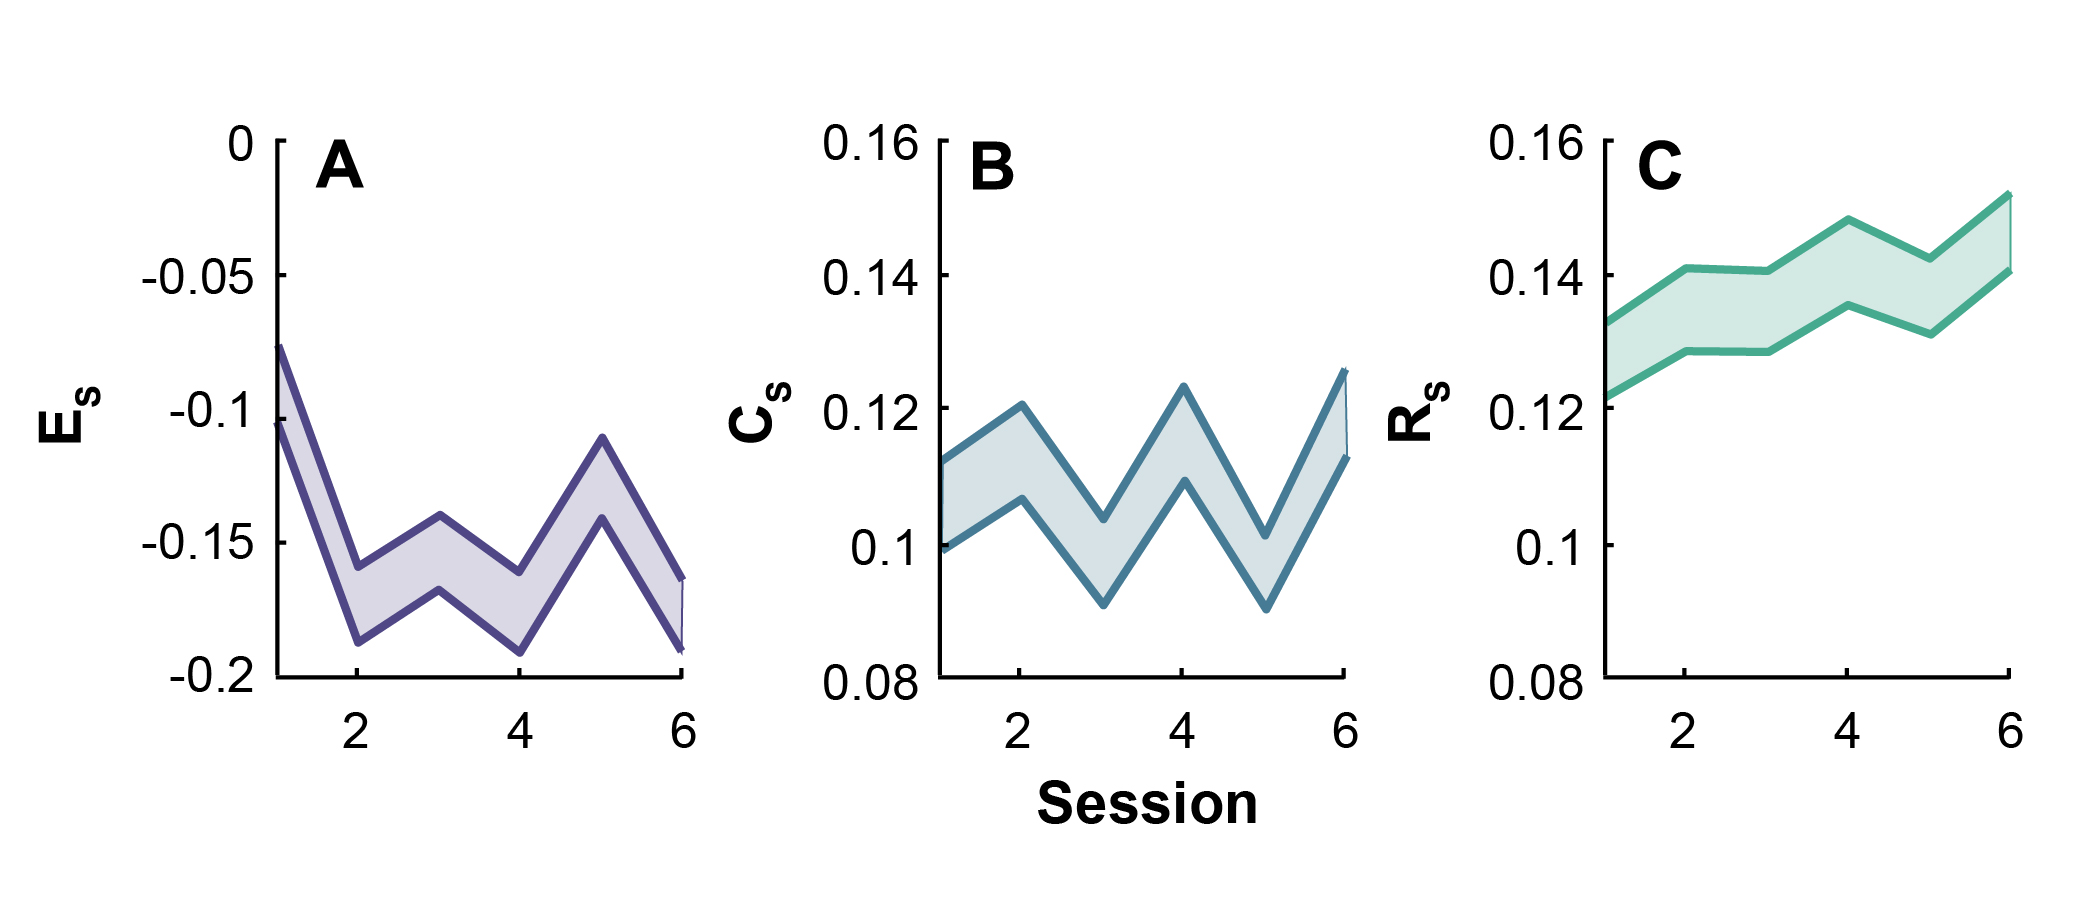 Figure 4. Error and resolution change throughout the whole course. The average error value tended to decrease (A), calibration values tended to remain the same (B), and resolution values tended to increase (C) throughout the course. Each shaded bar represents the mean +/- 1 standard error of the mean. Click to enlarge |
Student subgroups
The above analyses treated our students as a single cohort, which appeared to show the same general changes in metacognitive accuracy across both single sessions and the whole course. We performed two exploratory analyses intended to examine whether this assumption was true.
We first performed a supplementary principal components analysis (PCA) using the entire collection of ∆ values (i.e., ∆EI, ∆Es, ∆CI, ∆Cs, ∆RI and ∆Rs) to determine whether these general trends were exhibited by all students. This procedure determines whether a combination of factors or one factor alone best explains the variability within a set of data. PCA revealed that ∆EI and ∆ES values together could explain 96% of the variability within our cohort’s shift in metacognitive indices. This shows that error was the primary way in which metacognitive accuracy changed both throughout class sessions and throughout the course as a whole. Figure 5 shows how the direction in which the error metric changed over both medium and long time scales partitioned students into four distinct categories. We named the first group “receptors”: Their error tended to become more positive throughout both class sessions and the course. The absolute error values (i.e., EI and ES) of this group were negative; therefore, this positive shift shows that they were able to use the provided feedback to shift their error values toward zero during class (an initial gain) and then maintain this shift throughout the course (“positive retention”). The opposite was true for a group we named “inverters”: Despite being shown they had consistently underestimated their abilities, this group tended to underestimate themselves more as class sessions and the course progressed. The subgroups we named “doubters” and “reflectors” showed a combination of both patterns. Doubters displayed positive shifts during class but did not maintain them over time, whereas reflectors did not improve their error during class but eventually did over the course.
Second, to evaluate this further, we undertook an analysis of ∆ES values to determine whether there was a relationship between improvements vs. decrements in metacognition and performance over the duration of the course. To do this, we created two distance metrics, which captured improving (positive values) and worsening (negative values) metacognition independent of a student’s initial under- or over-estimation of their abilities. This is necessary because students with either initially positive or negative errors can improve their metacognitive accuracy. Most students appeared to initially and progressively underestimate their abilities; however, treating them as a single cohort may have obscured students who did not follow this general pattern. For example, a student with ES1 and ES6 values of -0.60 and +0.20 would have an ∆ES value of +0.80 (positive retention) and “traveled” 0.60 toward zero and 0.20 away from zero. The shift toward zero is a metacognitive improvement, whereas the shift away from zero is a metacognitive decrement. A student with ES1 and ES6 values of +0.60 and -0.20 would instead have an ∆ES value of -0.80 (negative retention) but “traveled” 0.60 toward the ideal zero value and 0.20 away from it. Thus, while the ∆ES values shows whether a student shifted toward under- or over-estimation, partitioning of this shift into zero-referenced distances shows how much of that shift was an improvement and how much was a decrement. One can also imagine cases in which a student’s error becomes progressively more negative (as in the majority of our cohort) or positive throughout the course. In this case, the student’s metacognitive accuracy is continually worsening and the distance “traveled” is always away from zero.
Figure 6 shows that there is a gradient of both improvements (toward zero, in green) and decrements (away from zero, in blue) for students with varying levels of initial and final error. Overall, approximately one quarter (26%) of our students’ ∆ES values contained only improvements, another quarter (23%) contained both improvements and decrements, half contained only decrements (48%), and a minority did not change (3%).
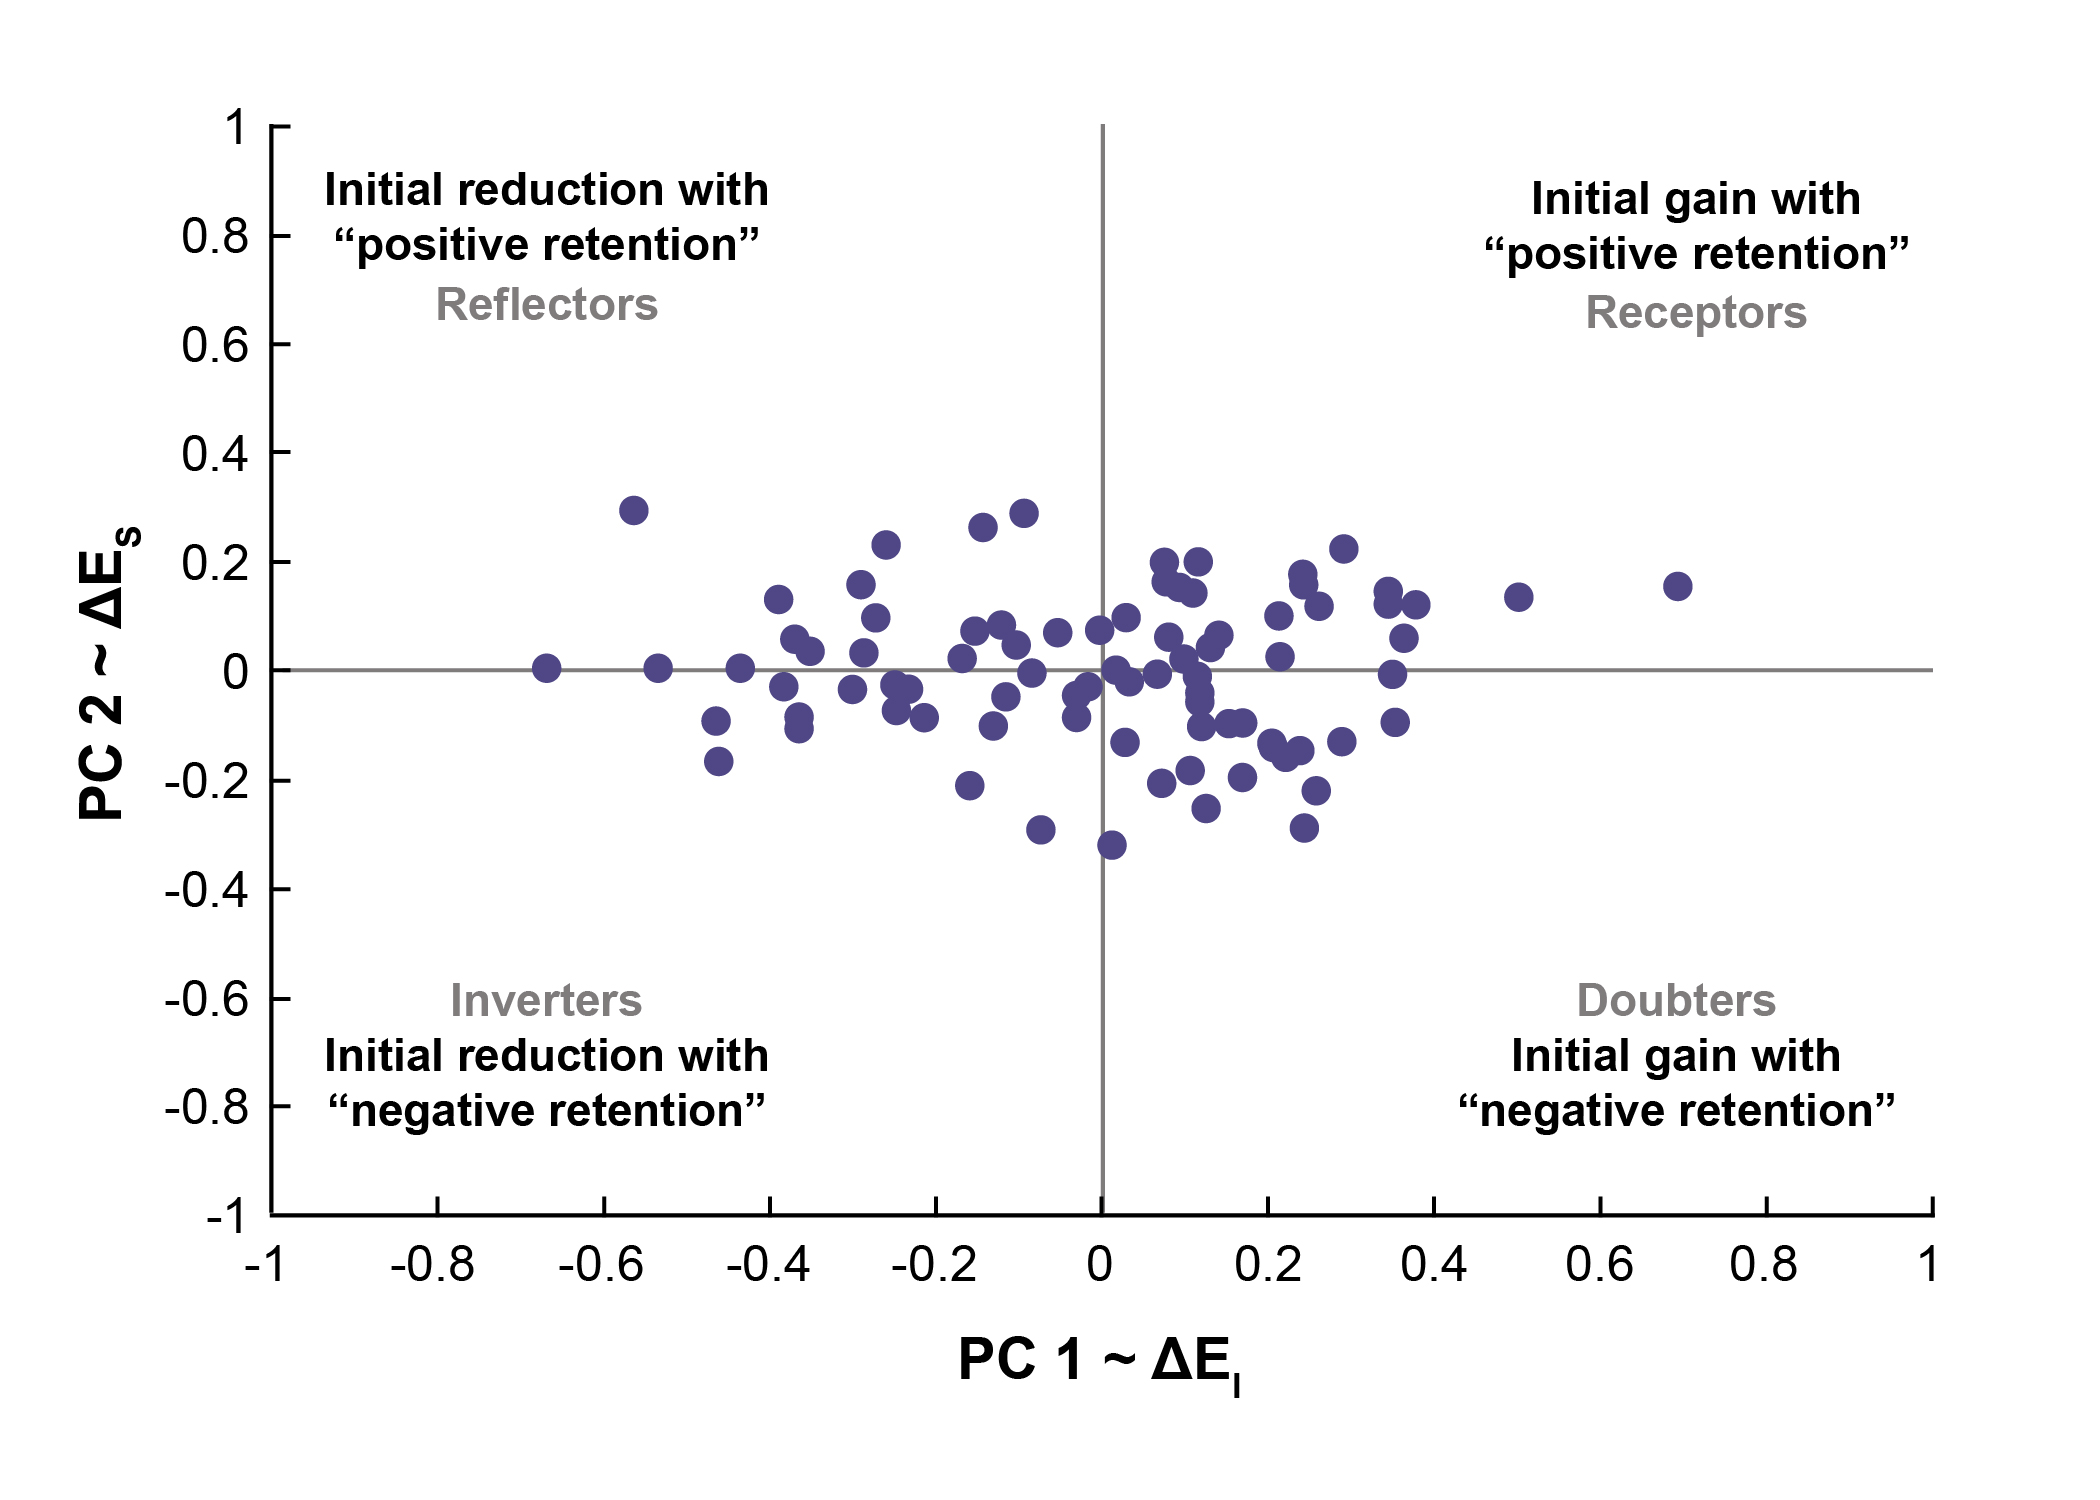 Figure 5. Changes in metacognitive error occur in different directions and at different times. Metacognitive error became more positive or negative throughout a session (x-axis, an initial gain or reduction, respectively) or throughout the course (y-axis, “negative retention” or “positive retention”). There was an approximately equal number of students (one dot = one student) who fell into each of the four quadrants defined by these axes. Each quadrant is labeled with a proposed name, which encapsulates how metacognitive error changed. |
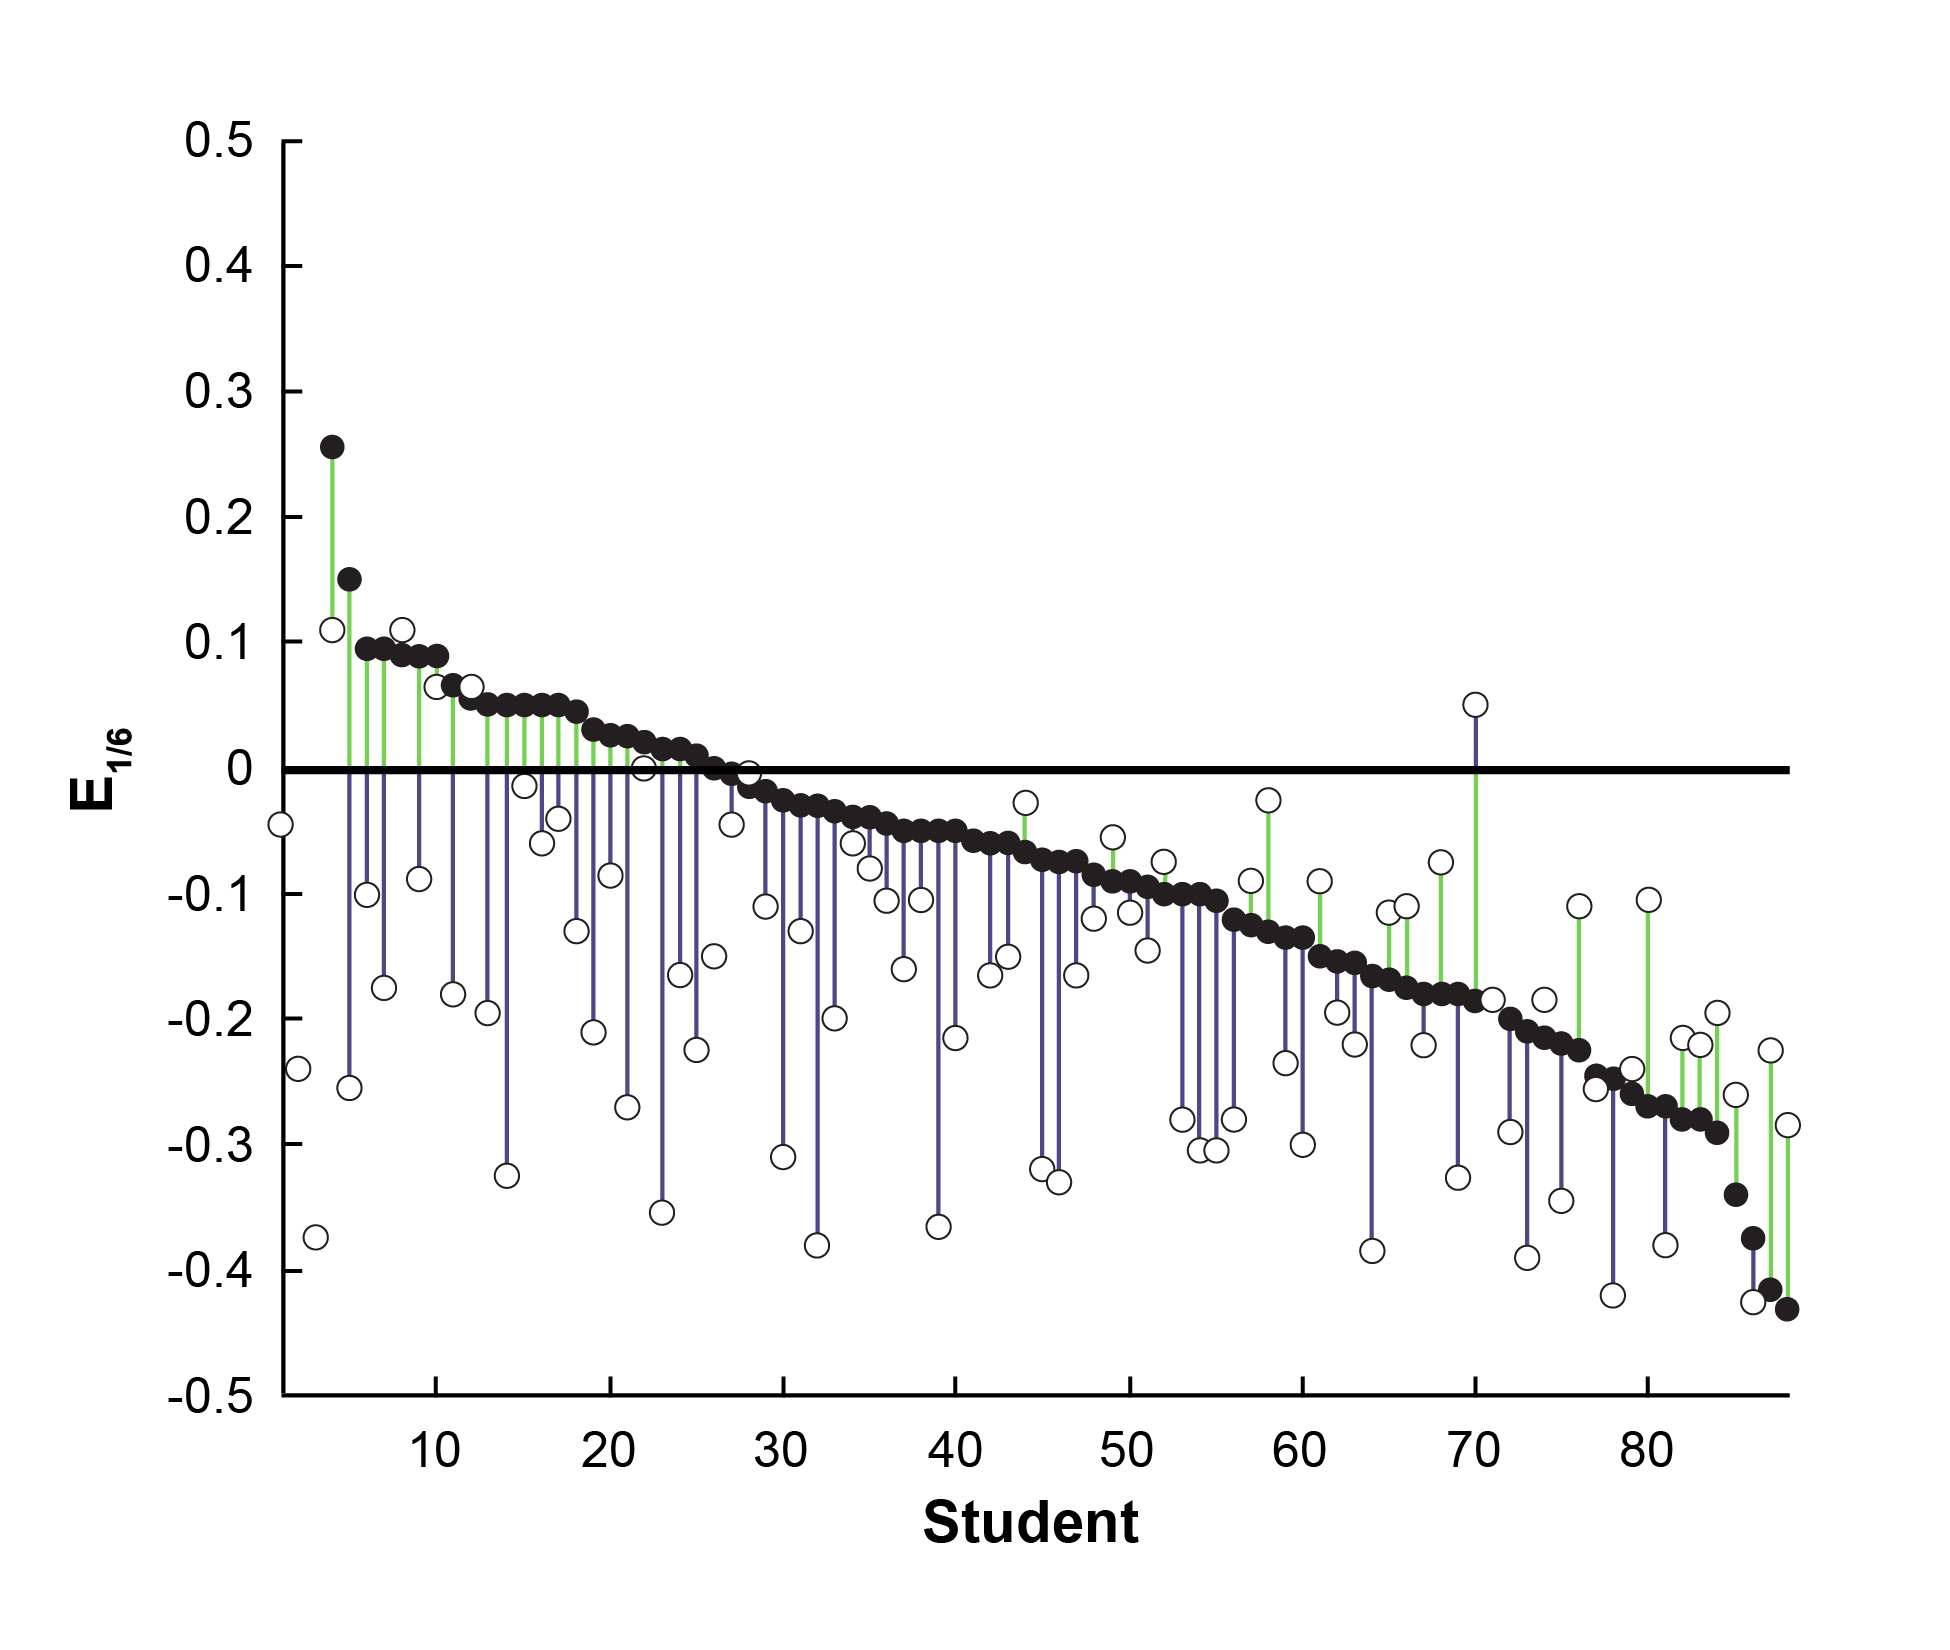 Figure 6. Error shifts across the course consist of both improvements and decrements in metacognition. The difference between a student’s initial error (E1, black circles) and final error (E6, white circles) represents the whole course shift in metacognitive accuracy (∆ES). This shift can be positive (black circles below white circles) or negative (black circles above white circles) and consists of metacognitive improvements (green lines), decrements (blue lines) or both. The reference line at zero indicates the ideal error value. The three open circles at the leftmost portion of the graph show E6 values for the students who were absent during the first week of class. Click to enlarge |
A correlation between our cohort’s distance metrics and their change in performance throughout the course showed that students with the largest magnitude of metacognitive decrements tended to demonstrate improvements in performance (i.e., more correct answers in the final week of the course, ρ = -0.46, p < 0.001) whereas there was no relationship between the magnitude of metacognitive improvements and changes in performance. On the other hand, students who scored lowest on a 350-item mock national board examination given before the course began tended to show the greatest metacognitive improvements throughout the course (ρ = -0.38, p = 0.015). These findings reiterate the complexity inherent in determining relationships between metacognition and performance because all students’ journeys consist of different locations (i.e., starting and ending points, direction of travel) and take a different amount of time (i.e., items, sessions or a whole course).
Discussion
This is the first investigation to characterize how feedback can change metacognitive accuracy over time. Our results showed that providing feedback over short, medium and longer time scales gave students the potential to improve their metacognitive accuracy, error, calibration and resolution. However, not all students utilized the feedback to this end. This is shown by the variety of ways in which the metacognitive indices changed from one item to the next, throughout a session and throughout the course.
Our item-by-item analysis revealed the presence of confidence “streaks.” Low- and high-confidence responses both tended to be followed by responses with similar confidence judgements. This shows that students did not necessarily use the immediate feedback regarding question correctness to their advantage. For example, partially informed items, which occur when a student is not confident but correct, tended to be followed by uninformed or partially informed items. This suggests that instead of adjusting their confidence to match potential correctness on a following item, students instead tend to issue low confidence judgements independent of the eventual outcome. Similarly, the rare occurrence of misinformed responses, which occur when a student is confident but incorrect, tended to be followed by well-informed responses. This suggests that “wrong but confident” items were brief slip-ups surrounded by otherwise correct but confident items. The association between misinformed and well-informed responses supports results from a previous investigation by Metcalfe who found that errors committed with high confidence are more readily corrected.7 Thus, students with high confidence may not always be correct, but instead continually possess the willingness to learn from their mistakes. The presence of our “item-by-item” temporal patterns showed that it is confidence, not metacognitive accuracy, that is maintained over short time scales. One would expect associations between either uninformed and well-informed or misinformed and partially informed items if the latter were true (i.e., one continually knows what they know and don’t know).
Most of our students tended to underestimate their abilities at the beginning of a session and at the beginning of the course: The average value of the error metric was negative in both instances. This is a metacognitive inaccuracy: Negative values result when one’s average confidence is less than their average correctness. Knowing they had underestimated their abilities (via visualization of the metacognitive indices) did not improve metacognitive accuracy in most students. Instead, the average error value tended to decrease further both throughout sessions and the course. This supports several observations made regarding the current generation of students who are sometimes broadly characterized as possessing high levels of anxiety, insecurity and risk aversion.8,9 Each of these characteristics may lead a student to avoid committing errors and ultimately learning.
Our single session and whole course results also suggest that learning to modify calibration and resolution may take different amounts of time. For example, while calibration values tended to increase throughout a single session, resolution values tended to increase throughout the whole course. The increment in calibration values represents a reduction in metacognitive accuracy and shows that students learned to less closely match their confidence judgements with their eventual correctness during class. On the other hand, the increment in resolution values is an improvement in metacognitive accuracy because it suggests that students learned to utilize a greater gamut of confidence ratings by the end of the course. Thus, despite eventually possessing a greater spectrum of internal confidence judgements to choose from, students were not able to align this spectrum to the associated outcomes.
The persistence of confidence judgements across short time scales and the persistent pattern of underestimation (evidenced by reductions in error values and increments in calibration values) across both medium and longer time scales show that our cohort of students took different amounts of time to incorporate the feedback provided to them. This heterogeneity was highlighted by our supplementary PCA analysis, which identified four subgroups of students, each of whose medium- or long-term metacognitive error shifted toward under- or over-estimation. A partitioning of the whole course metacognitive error shifts into improvements and decrements further highlights the heterogeneity inherent within our cohort of students. For some, a negative shift in error took them from initially overestimating their abilities to correctly assessing them. In others, a negative shift in error compounded their initial inaccuracy despite demonstrating the largest improvement in course performance.
The different directions and period over which our metacognitive indices changed may be related to the notion that dedicated neural circuitry is responsible for handling learning over different time scales.10 This is a critical observation to make when designing and implementing optometric curricula. For example, imagine giving feedback while teaching tonometry. You are teaching a student who is overconfident and immediately professes proficiency in the skill. They are humbled over the next couple of weeks and display a pattern similar to the student on the leftmost side of Figure 6: Their metacognitive error is initially positive but improves over time. We speculate this may involve learning to utilize a greater gamut of confidence ratings (improving resolution). On the other hand, imagine students who are instead intimidated by the procedure but also improve over time. It is a joy to witness students who also believe in this improvement (rightmost side of Figure 6) and sometimes perplexing to watch students who don’t. How do you best teach each of these students? Our study showed that because students process feedback in different ways over different time scales, there is not a single answer to this question.
Our investigation possessed several weaknesses. First, the collection and sequence of items both within and across sessions was not standardized. This is likely what led to the apparent fluctuation of metacognitive indices. Second, the IOR did give some verbal encouragement and feedback to students during the course. This may have influenced the way students rated themselves. Third, the students were not given any practice issuing probability judgements before the course began. This is a possible explanation for why the majority of the change in error occurred after the first session of the course. Last, because the national board examinations became progressively closer in time as the course went on, each student’s confidence and/or correctness could have changed as the date drew nearer. We look forward to addressing these weaknesses in a future investigation by:
- planning a practice session before the teaching intervention officially begins
- using items standardized for content familiarity and difficulty (This would enable “cleaner” tracking of metacognitive ability across items, sessions and the course.)
- using this investigation’s exploratory analyses to formally examine the relationship between each of the metacognitive indices
- using a survey to gauge whether students felt the course improved their metacognition
Conclusion
The field of metacognitive accuracy and its trainability is ripe for examination in optometry and the medical professions as a whole. We are excited to use the current investigation as a platform to begin asking larger questions that can help improve the way we guide our students through professional optometric programs. Our results highlight that students truly do interpret our messages in different ways and take varying amounts of time to incorporate them into their optometric schema.
References
- Fleming SM, Lau HC. How to measure metacognition. Front Hum Neurosci. 2014 July;8(article 443):1-9. doi: https://doi.org/10.3389/fnhum.2014.00443.
- Crawford JD, Stankov L. Age differences in the realism of confidence judgements: a calibration study using tests of fluid and crystallized intelligence. Learn Individ Differ. 1996;8(2):83-103. doi: https://doi.org/10.1016/S1041-6080(96)90027-8.
- Kampmeyer D, Matthes J, Herzig S. Lucky guess or knowledge: a cross-sectional study using the Bland and Altman analysis to compare confidence-based testing of pharmacological knowledge in 3rd and 5th year medical students. Adv Health Sci Educ Theory Pract. 2015 May;20(2):431-40. doi: 10.1007/s10459-014-9537-1.
- Baranski JV, Petrusic WM. The calibration and resolution of confidence in perceptual judgments. Percept Psychophys. 1994 Apr;55(4):412-28. doi: 10.3758/bf03205299.
- Bennett ES, Lakshminarayanan V. Butterworth Heinemann’s Review Questions for the NBEO Examination: Part One. Butterworth-Heinemann; 2005.
- Hunt DP. The concept of knowledge and how to measure it. Journal of Intellectual Capital. 2003 Mar;4(1):100-13. doi: 10.1108/14691930310455414.
- Metcalfe J. Learning from errors. Annu Rev Psychol. 2017 Jan 3;68:465-489. doi: 10.1146/annurev-psych-010416-044022.
- Mendoza K. Teaching squirrels: how to reach generation Z and create lasting engagement. Torrid Faith Publishing and Amazon Distributors; 2021.
- Seemiller C, Grace M. Generation Z: a century in the making. Routledge; 2018.
- Lohse KR, Wadden K, Boyd LA, Hodges NJ. Motor skill acquisition across short and long time scales: a meta-analysis of neuroimaging data. Neuropsychologia. 2014 Jul;59:130-41. doi: 10.1016/j.neuropsychologia.2014.05.001.