PEER REVIEWED
Assigning Fair and Defensible Clinic Grades:
a Normative Statistical Approach
Brian K. Foutch, OD, PhD, FAAO, Richard Trevino, OD, FAAO, Amy S. Ferguson, OD, MS, Yutaka Maki, OD, MS, FCOVD, Russell S. Coates, OD, MEd, and Janet Summers, OD, CMHP, MS
Abstract
Grades in clinical courses matter. They are often used to determine clinical academic awards, scholarships ― and perhaps most importantly ― interns’ suitability for graduate optometric education opportunities. Aware of these stakes, clinic preceptors may feel pressure to grade leniently or assign similar grades to all students. A fair method of adjusting for differences in preceptor biases is then needed. In this article, the authors propose a technique to adjust for differences in evaluators who are often working in variable clinical settings with different interns and clinical demands. The technique employs the advantages of both normative and criterion-based grading to adjust for differences in leniency and variability between preceptors. This work provides a grading framework that is transparent to all stakeholders but places responsibilities at the appropriate level. That is, clinic preceptors perform clinic performance evaluations, and clinic academic managers perform grading.
Key Words: normative grading, criterion-based grading, clinic interns
Background
There are many ways to calculate a final grade in any course.1 However, when it comes to individual evaluations of student work, there are only three types of grading: atomistic, holistic or analytical.2 Atomistic grading strictly follows rubrics or grading keys, such as in static multiple-choice examinations. This method of grading is rigid and may not be well-suited for activities such as clinical patient care that require higher-level thinking.3 Holistic grading uses an overall impression of the student performance and views grading keys as guides. This method embodies the idea that all professionals, regardless of discipline, approach any academic work with a set of expectations. Nilson refers to these expectations or criteria as dimensions and describes how most graders of written scholarly work can rely on as many as 20 dimensions to arrive at a single grade.3 Sample analogies of these dimensions in graded clinical care may be the use of appropriate terminology, accuracy of clinical findings and proper analysis of these findings. However, it would be unfair to grade novice clinicians based on multiple dimensions gained from years of clinical experience. In addition, those dimensions may be different among graders. Thus, we turned to an analytical approach at our institution. In analytic grading, rubrics define expected performance levels for specified key dimensions of the overall graded task. Graders are then required to assign a separate score for each dimension.4 Analytical grading remains challenging, even for very experienced faculty.5 Despite supplied external criteria, some graders (knowingly or unknowingly) have a difficult time turning their private opinions or judgments into public ratings.6
Those of us who assign grades in clinical courses know some of the challenges very well. First, there is no consensus regarding the value of even assigning numerical or letter grades.3,7-14 Assigning grades can keep students accountable and can be motivating, and students also care about grades.3,8 However, at least one author has suggested that grading is largely based on cultural assumptions.10 Others have also challenged grading as a reward, suggesting it is a demeaning practice.11 At the very least, grading can inhibit learning.12,13 For example, teamwork and cooperation is important in providing quality healthcare, but both can be discouraged by sorting students into merit levels.3,14 The second issue is that, if grades are assigned, students want them to be a fair and valid representation of their work, but clinic academic managers mostly want grades to represent whether students will (or will not) succeed at the next level.15,16 The third issue, which is the subject of this communication, is how evaluations from multiple clinic preceptors in various settings should be aggregated into a final course grade.
Previous authors have examined overall practices and imprecision of grading in medical clerkships, and at least one study has examined the effects of training on clinical performance evaluations.17-19 While the studies are few, they all reveal that grades (which are often simple arithmetic averages of performance evaluations) are often inflated. We have also observed grade inflation and deflation and believe they occur when the responsibility of assigning the grade ― rather than just evaluating clinical performance ― is placed on clinic preceptors.
Clinic preceptors at our institution had previously expressed surprise or disagreement with the final clinic grade of certain interns even though their submitted clinic grades are often generous and uniform such that nearly the same grade is given to all interns across most patient encounters. This was perhaps the biggest motivator of the current work, where we simply describe our technique of transforming analytical evaluations from multiple clinic preceptors into what we consider fair and defensible grades. The technique is criterion-based, allowing students to understand how their clinical performance is tied to posted dimensions of clinical care. It is also normative-based, transforming raw numerical grades into standardized (i.e., z-) scores for each grader. To our knowledge, no published statistical approaches address the disparity in clinical performance evaluations submitted by various clinic preceptors. The purpose of this paper is to present a fair and defensible statistical method that allows preceptors to evaluate clinic performance as they see fit and enables clinic academic managers to assign grades using these evaluations in a way that corrects for between-preceptor differences in evaluating student performance.
Methods
Individual evaluations

Table 1. Click to enlarge
Both third- and fourth-year optometry interns at our in-house clinics are given a single grade per day from each clinic preceptor, regardless of how many patient encounters they share. Interns may then receive as many as four different grades per day depending upon how many different preceptors they are assigned that day. This is administratively unavoidable due to scheduling and clinic productivity pressures. We have observed that some preceptors are unwilling to grade students differently, limiting the spread of their grades. In addition, preceptors may be biased toward grading leniently or stringently. To combat this, all interns and supervising preceptors are supplied with scoring criteria. We use five grading dimensions: efficiency (speed), accuracy of findings (skills), knowledge/analysis, communication, and charting/billing (Table 1). Preceptors assign either exceeds, meets, or below expected for each dimension and enter the grades into a customized commercial medical education system (Meditrek, HSoft Corporation, Morrisville, PA). If an intern meets expected levels for all dimensions, their grade is 85%. For each individual dimension, intern grades are adjusted up (if exceeds) or down (if below) for that dimension. These adjustments are shown in the headers in Table 1. Preceptors are also encouraged to provide written feedback to interns, elaborating on either the overall performance or on specific dimensions. When entering the grade, preceptors are shown a draft (including the calculated numerical grade) before final submission. Interns never see the numerical grade. Rather, they only see written comments and whether they met, exceeded, or were below expected on the five dimensions.
Arithmetic adjustments
To achieve the goal of improving fairness in grading, we had two sub-goals. The first goal is that mean grades for each given preceptor would be equal to the grand mean (GM, i.e., the average grade for all graders combined). This controls for inter-grader variability or directional (positive and negative) grader biases. The next goal is to control the intra-grader variability. That is, by example, we want a grade that is one standard deviation above the mean grade for a given preceptor to transform into a grade that is one overall standard deviation (OSD) above the GM of all grades.
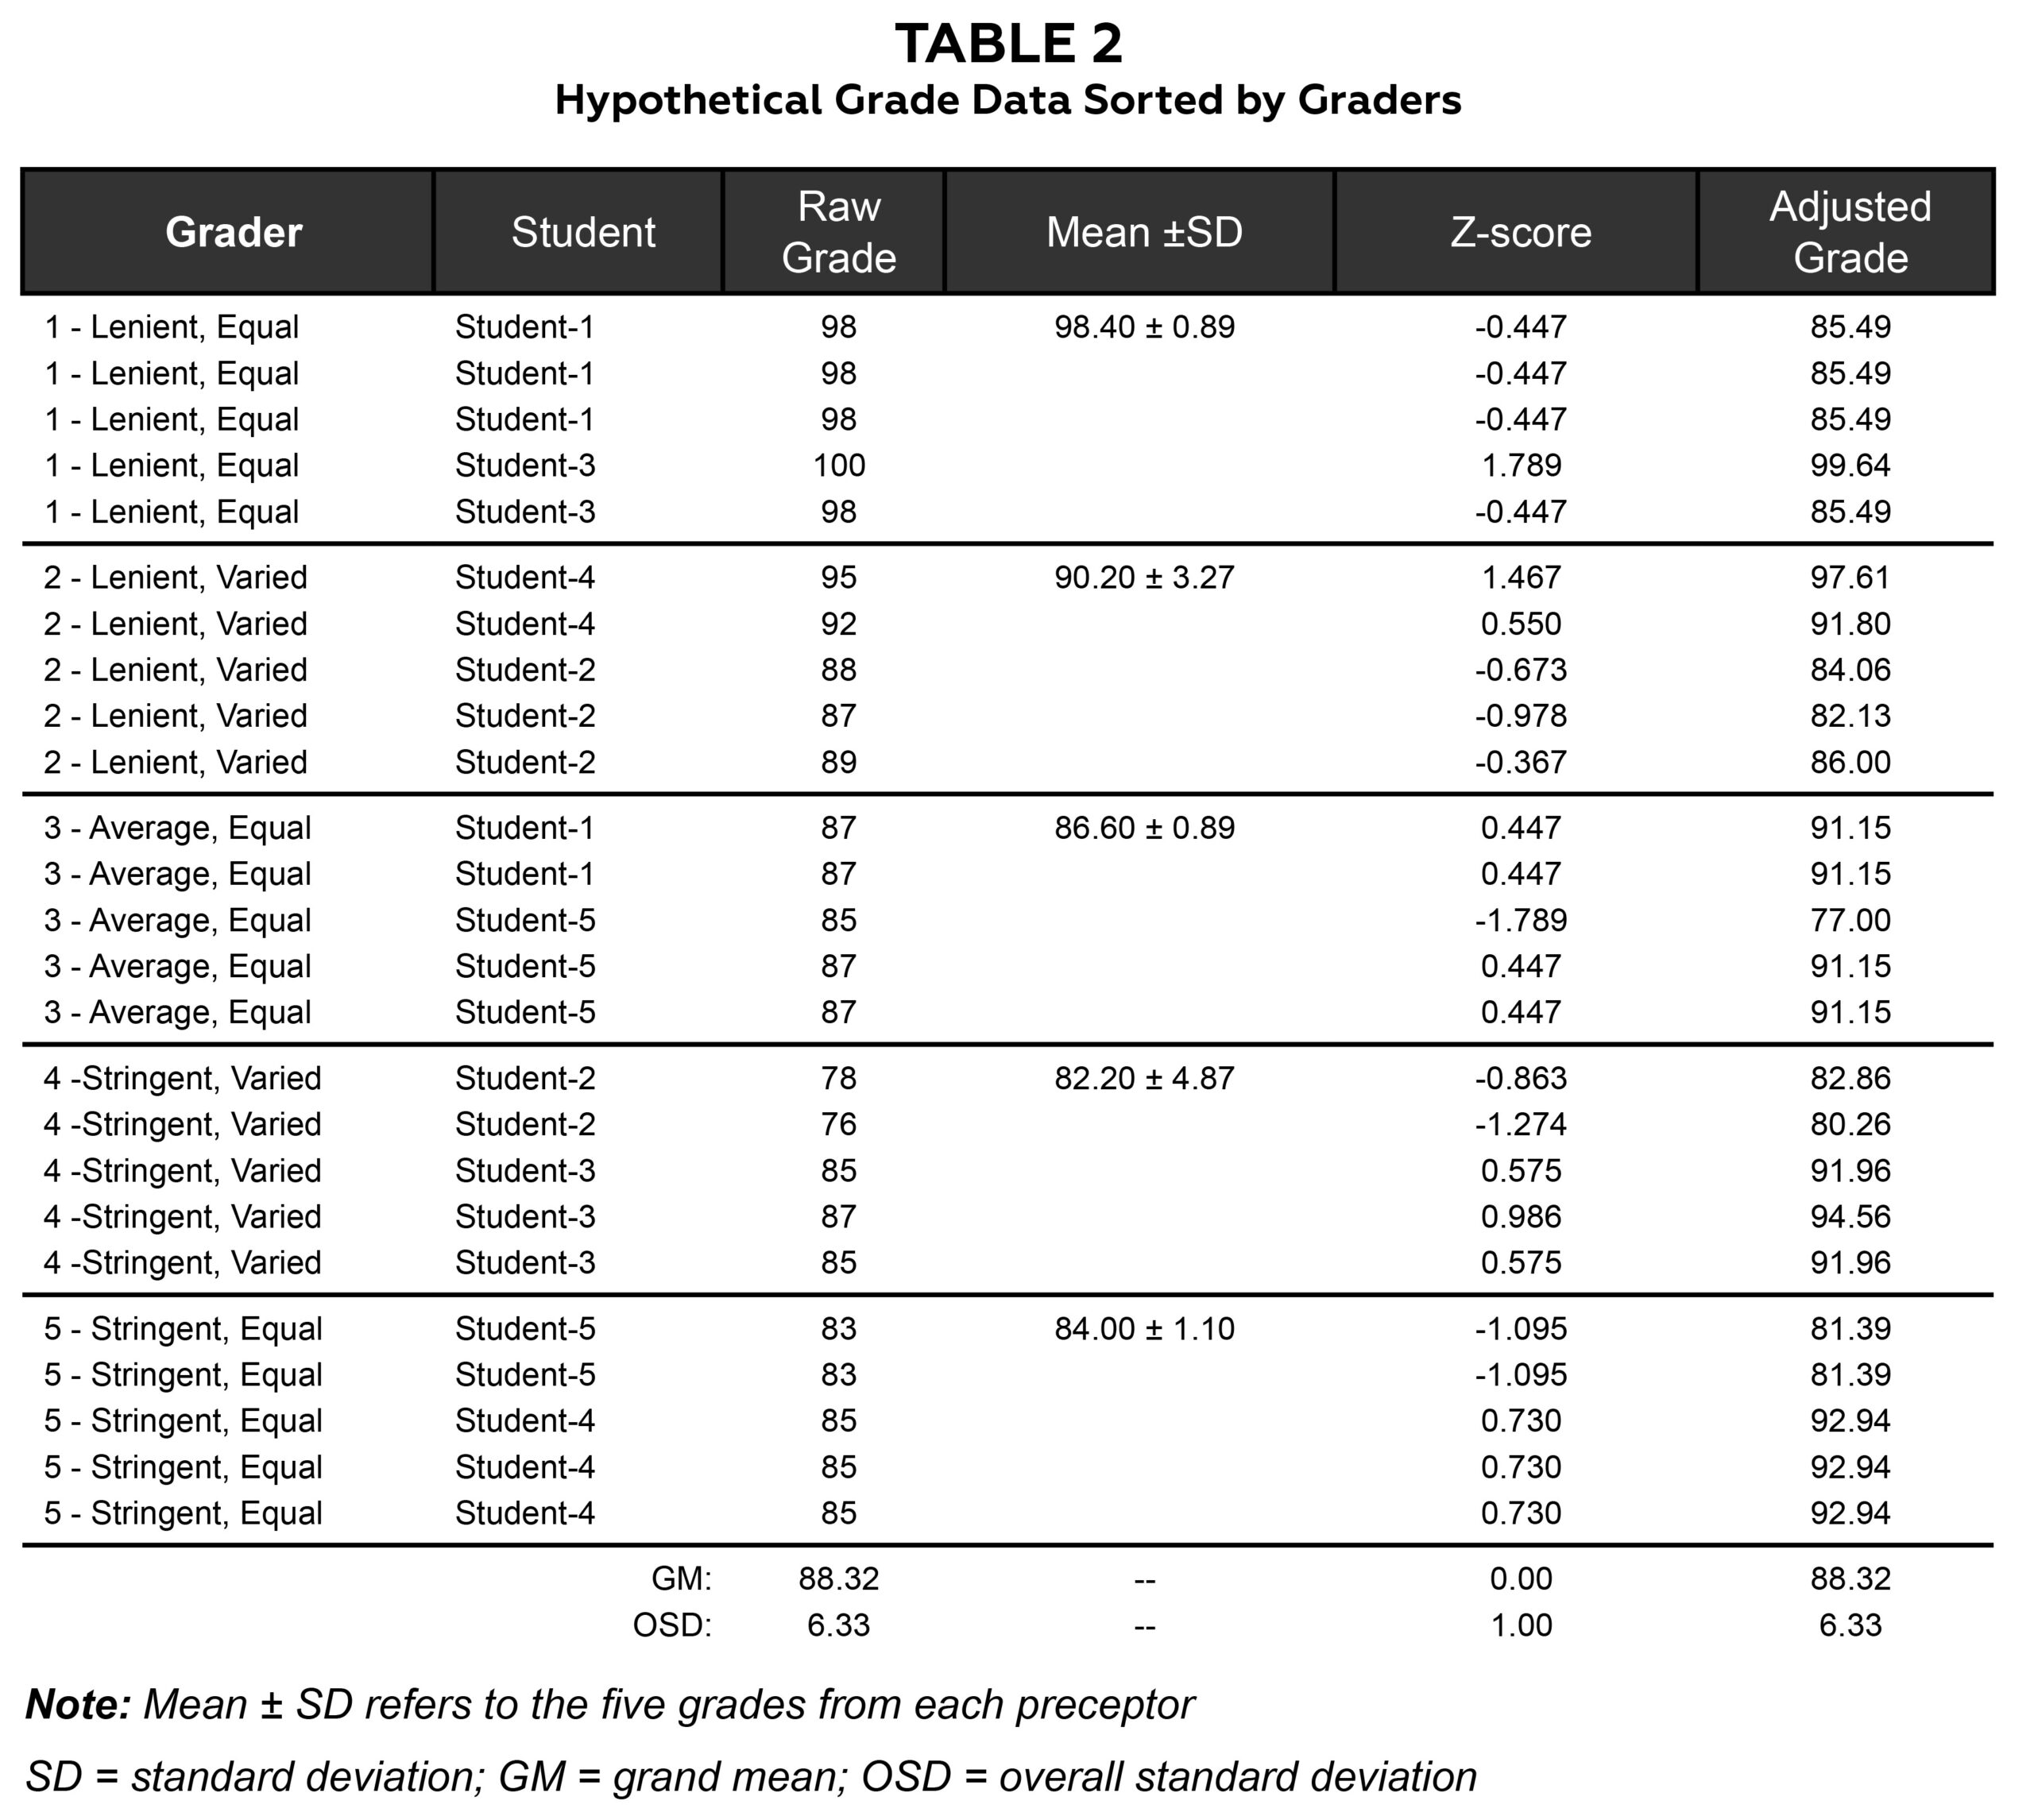
Table 2. Click to enlarge
The best way to describe our adjustment technique is by a sample of hypothetical grades. All the presented data are hypothetical, and all statistics, tables and figures were produced using Microsoft Excel (2021). Table 2 shows hypothetical data for five graders and five students. These hypothetical graders are lenient, average or stringent and give either uniform or varied grades. Obviously, there may be other types of clinic graders, but these are sufficient to demonstrate the technique. The third column of the table shows raw grades given by the grader to each student for each day in clinic. The raw grades are transformed into standardized (z-) scores by z = (raw grade – M)/SD, where M = preceptor mean and SD = preceptor standard deviation. For example, a raw grade of 98 from grader 1 (mean = 98.40, SD = 0.89) would be: z1(98) = (98 – 98.4)/0.89 = -0.447. The z-scores are subsequently transformed back into adjusted grades by: Adjusted grade = GM + z-score x OSD, where GM = grand mean of all grades (88.32) and OSD = 6.33 for all raw grades. Using the same example of a raw grade of 98 from grader 1 (i.e., z-score = -0.447), the adjusted grade = -0.447 x 6.33 + 88.32 = 85.49. So, a grade that was approximately 0.5 SD below the preceptor’s mean adjusted to a grade approximately 0.5 OSDs below the grand mean.
Results
To determine the relationship between raw and adjusted grades, we calculated the correlation coefficient (Pearson’s r reported), r = .318. This correlation was not statistically significant (p = .121) and may indicate for this small hypothetical sample that raw and adjusted grades are different representations of clinical performance. A scatter plot of raw vs. adjusted grades shows this limited relationship in Figure 1.
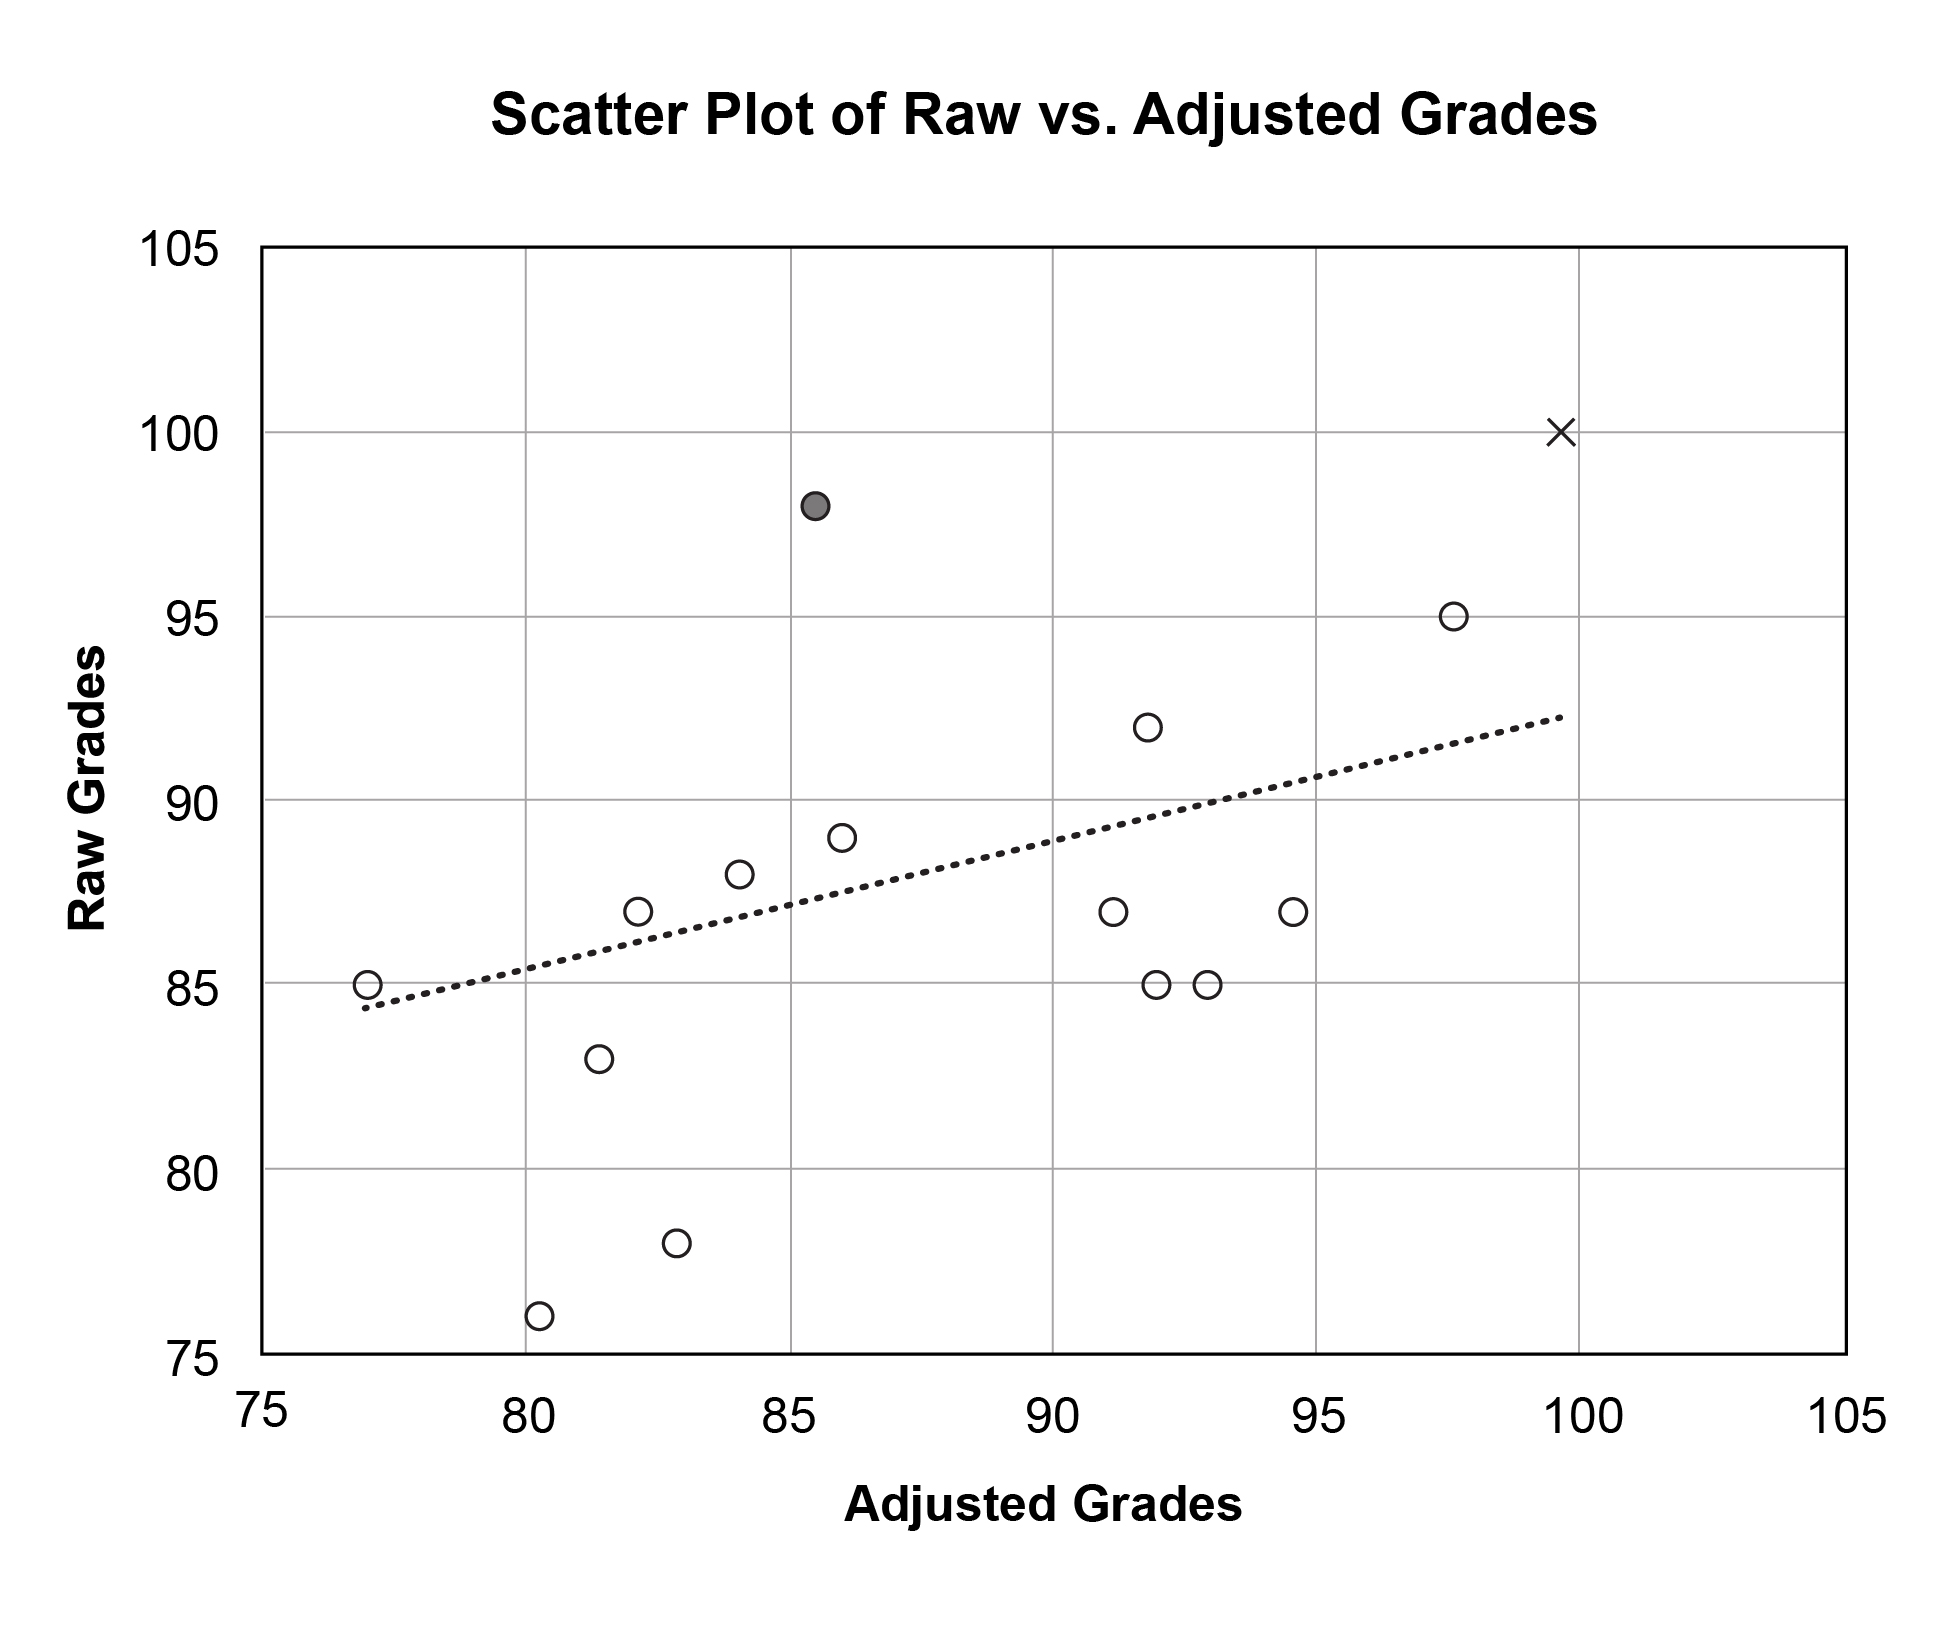 Figure 1. The filled circle and ‘x’ represent grades given by a lenient grader with a limited spread in grades (Grader 1). The raw grade of 98 represented by the filled circle is a below average grade for Grader 1; therefore, it adjusts to a below average grade overall (i.e., 85.49). The raw grade of 100 represented by ‘x’ is nearly two standard deviations above Grader 1’s mean (z = 1.789) and adjusts to a grade 1.789 overall standard deviations above the average grade overall (i.e., 99.64). Click to enlarge |
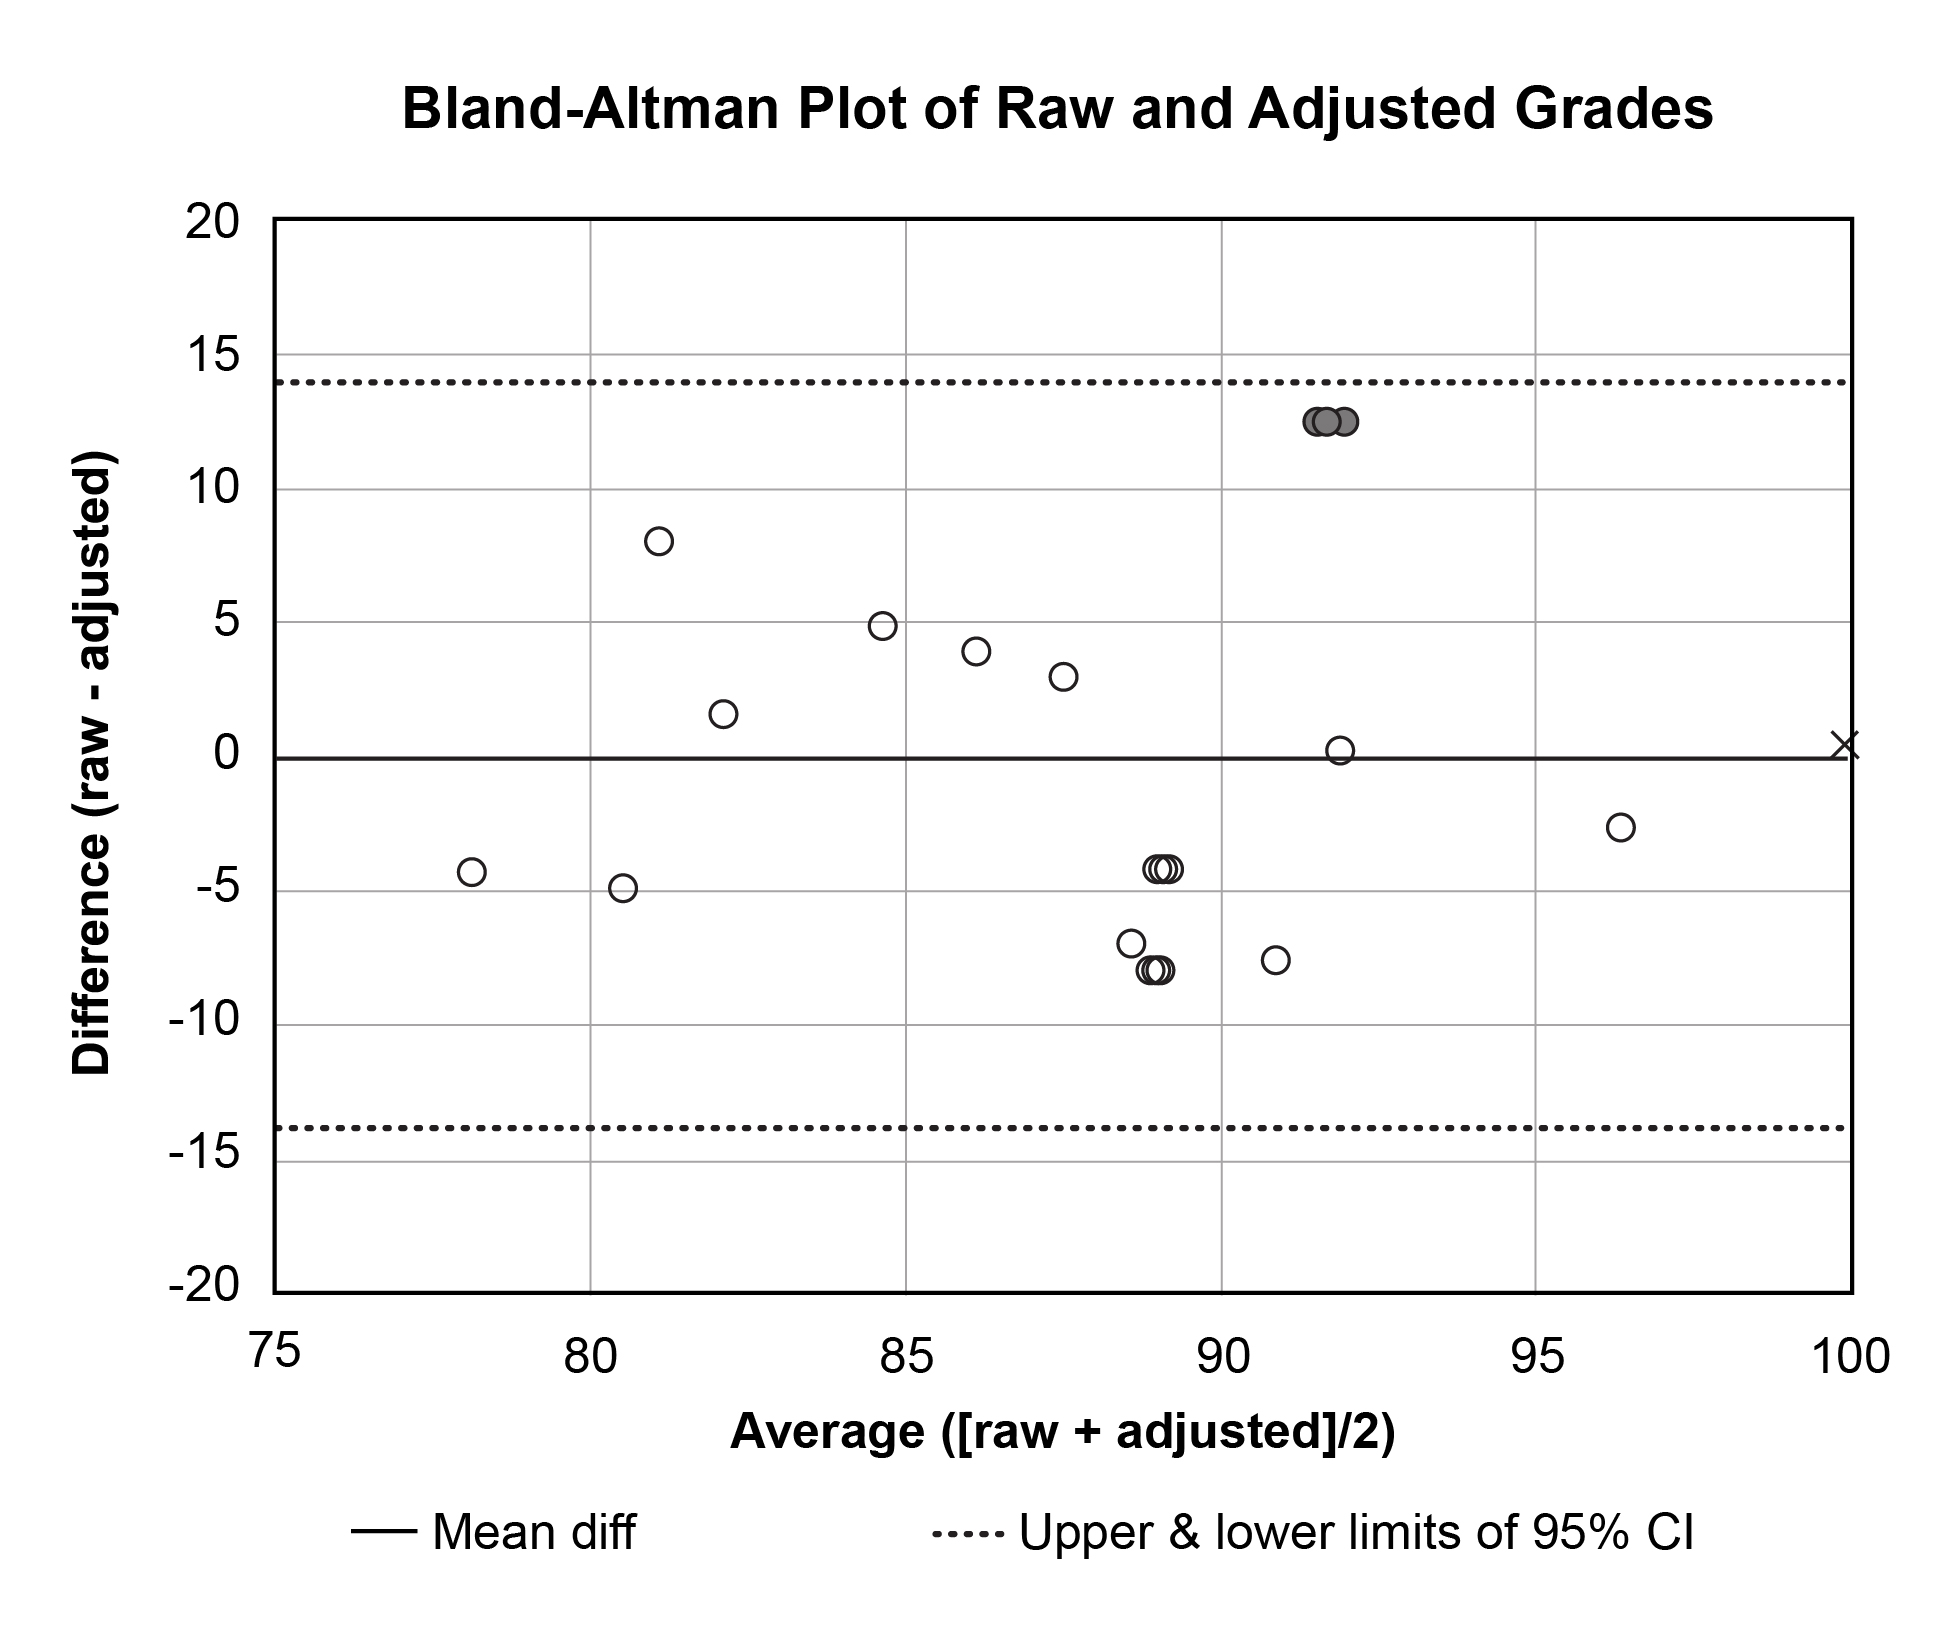 Figure 2. The data appear equally scattered above and below the mean difference line, which indicates that neither raw nor adjusted methods are biased toward high or low grades. The filled circles and ‘x’ represent the same points as in Figure 1. Click to enlarge |

Table 3. Click to enlarge
Table 3 is sorted by student and shows all raw and adjusted mean grades. The last two columns of Table 3 are the paired grade differences (i.e., raw – adjusted) and averages (i.e., [raw + adjusted]/2), respectively, which are plotted against each other in Figure 2 according to a technique described by Bland and Altman.20 In Bland-Altman (B-A) plots, lines representing the mean difference ― as well as upper and lower bounds of acceptable differences ― are also plotted. Any group of standardized scores will always have a mean z-score equal to 0, and the final step of our adjustment technique is to multiply z-scores by the OSD then add the grand mean. Therefore, in our technique, the mean of all adjusted grades will be equal to the grand mean of the raw grades (see Table 2 for sample). The mean difference line will then always be along the x-axis (i.e., mean differences = 0). While Bland-Altman does not prescribe the upper and lower bounds, it is suggested that all points should lie within the 95% confidence interval (CI) of the mean difference. All our points lie within these bounds. The B-A plot can also highlight whether raw or adjusted grades are systematically too high or low. If so, most points would be above (if raw > adjusted) or below (if raw < adjusted) the zero line. Because the points on the sample B-A plot in Figure 2 are scattered equally above and below the x-axis, it suggests no consistent bias of one method vs. the other.
Discussion
Clinical interns are faced with managing many different conditions of variable complexities, and it makes grading their efforts challenging. Much of the difficulty in assigning fair grades in clinic courses arises from the use of multiple graders who want to run their own “classroom” and assign their own grades. We believe our technique fairly adjusts for most differences in preceptor grading.
The hypothetical grade data presented here helps us demonstrate the technique, but extreme cases could arise that are worth mentioning. Most of these cases would involve preceptors who give a limited spread of mediocre (i.e., “your work is adequate”) or generous grades. The first (and easy) example to handle is a grader who awards the same grade to every student. In these cases, all z-scores are 0.0, and all their grades are adjusted to the grand mean for all grades. However, there are, in our experience, graders who award mostly the same grade but a limited number of generous or below average grades. For example, assume a preceptor awards 50 grades of 85, one grade of 70, and one grade of 100. The mean ± SD = 85.00 ± 2.29, and z-scores for the two “exceptional” grades are z(70) = (70 – 85.00)/2.29 = -6.56 and z(100) = (100 – 85)/2.29 = 6.56. Assuming, by example, our GM of 88.32 and OSD of 6.33, these grades adjust to adjusted(70) = z(70) x OSD + GM = (-6.56 x 6.33) + 88.32 = 46.80 and adjusted(100) = (6.56 x 5) + 88 = 129.84. We believe these are fair adjustments, but they may create a perception of norm-referenced grading if the criteria are not properly and/or regularly applied. Barriers to doing so remain the subject of future studies.
We believe our technique corrects for two further, but related, challenges of clinic grading: bias and training. We have observed that there are extreme graders who are biased toward assigning either lenient or stringent grades. What are some causes of this? Leniency may be influenced by how “private” clinic grading is or how much they delay grading. One study found that individual graders were more likely to forget details than groups, but groups were more lenient graders after that same delay.21 However, in our clinical settings, students work with an individual grader, so this source of leniency is unavoidable. One alterable source of leniency may be lack of training, as Ogden et al. demonstrate that training shifts preceptors toward more stringent, criterion-based grading.19 They also suggest another likely cause of grade inflation: the tension between the mentor and grader roles of clinic faculty. That is, clinical faculty struggle with the shift from advocate or mentor during patient care encounters to judge during grading intern performance during these encounters. However, we believe this is one of the strengths of our technique. It allows clinic faculty to provide honest, legitimate, useful feedback to interns but puts the responsibility of calculating the final grade on the course coordinators.
Regarding training, there is documented intra-school inter-grader variation in medical school clerkships, and one known barrier to consistency between graders is lack of grader training.18 Training matters, and it has been shown that face-to-face training changes grading practices more than computer-based tutorials.19 However, there are administrative challenges to delivering face-to-face training with multiple preceptors practicing at multiple clinic sites. Regardless of the delivery mode, we encourage institutions to critically examine their training practices. Regarding non-administrative barriers to giving graders feedback about their biases toward stringency or leniency, it is possible that informing extreme graders of their practices may just create more “average” graders. In fact, our method may not always be wise, as arithmetically handicapping certain graders has also been shown to create more extreme grading.6 Further investigations of the effect of training on preceptor grading is warranted.
There are also issues dealing with multiple clinical encounters in a single day. Some preceptors are known to adopt a more sensitive “parallel” paradigm. That is, single clinical mistakes result in a low averaged grade for the multiple encounters. Others use a more forgiving and specific “series” approach. These graders give low grades only if the student makes mistakes on more than one or all the encounters. In addition, is it a limitation to have the grade displayed as a draft before submitting? It is certainly possible that it encourages preceptors to reject the analytical grade in favor of a more holistic “this is the grade I think they deserve” approach. Another limit to our approach is that most interns switch preceptors approximately halfway through the semester. If a preceptor shifts toward more stringent or lenient grading within a semester, the within-grader norm-referenced nature of the technique would cause an unfair shift toward lower or higher grades, respectively. However, this is no different than if the grades were not adjusted. We have no data on how many series or parallel graders we have or whether our preceptors shift in leniency or toward holistic approaches. These would be interesting extensions of our observations.
Student perspectives should not dictate final grades, but their opinions are valuable.22 There was concern that students would not like having the numerical grade withheld. They can calculate individual grades from the rubric, but they are reminded that their final grade is adjusted and are made aware of this technique. We never solicited opinions of students prior to launching this technique, but there is an informal global student acceptance based on post-course instructor evaluations.
We did not focus any of the current effort on the written feedback provided to the students by their preceptors. The software allows free text space to provide written feedback, but this is not required of preceptors. Written feedback has been shown to improve performance on follow-up, but our anecdotal experience is equivocal.23 Some interns tell us that they appreciate the feedback while others do not use or even read it. The latter behavior seems unusual but compares with previous reports.24 Formal analysis of intern and faculty acceptance of adjustment techniques is a worthwhile area of investigation.
Conclusion
Grading students is challenging. The variability of clinical encounters makes grading student clinicians even more so. While we cannot draw any inferences about clinic grading at other institutions or training settings, we do present a reproducible method of converting clinic performance evaluations into fair and defensible grades. The technique adjusts for between- and within-grader differences in leniency and uniformity, while interns still receive criterion-based preceptor feedback they can use to improve their clinical performance. We challenge fellow clinic academic managers to honestly examine their grading practices and consider a similar technique.
References
- Evaluation and Examination Service. Assigning Course Grades: Technical Bulletin #5. Iowa City: The University of Iowa; 1996.
- Stevens DD, Levi AJ. Introduction to rubrics: an assessment tool to save grading time, convey effective feedback, and promote student learning (2nd ed.). Sterling, VA: Stylus; 2012.
- Nilson LB. Grading student assessments. In LB Nilson, Teaching at its best: a research-based resource for college instructors (4th ed., pp. 303-316). San Francisco, CA: John Wiley & Sons, Inc.; 2016.
- Frey B. The SAGE encyclopedia of educational research, measurement, and evaluation (Vols. 1-4). Thousand Oaks, CA: SAGE Publications, Inc.; 2018. doi:10.4135/9781506326139.
- Isaacson JJ, Stacy AS. Rubrics for clinical evaluation: objectifying the subjective experience. Nurse Educ Pract. 2009 Mar;9(2):134-40. doi: 10.1016/j.nepr.2008.10.015.
- Williams RG, Klamen DA, McGaghie WC. Cognitive, social and environmental sources of bias in clinical performance ratings. Teach Learn Med. 2003 Fall;15(4):270-92. doi: 10.1207/S15328015TLM1504_11.
- Angelo TA. Doing assessment as if learning matters most. AAHE Bulletin 1999;51(9):3-6.
- Baer J, Kaufman, JC. Creativity research in English-speaking countries. In JC Kaufman, RJ Sternberg (Eds.), The International Handbook of Creativity. Cambridge: Cambridge University Press; 2006.
- Walvoord BE, Johnson Anderson V. Effective grading: a tool for learning and assessment in college (2nd ed.). San Francisco, CA: John Wiley & Sons, Inc.; 2010.
- Romanowski MH. Student obsession with grades and achievement. Kappa Delta Pi Rec. 2004;40(4):149-151.
- Kohn A. Punished by rewards: the trouble with gold stars, incentive plans, A’s, praise, and other bribes. New York: Houghton Mifflin Harcourt; 1999.
- Krawczyk RM. Effects of grading on student learning and alternative assessment [Internet]. Sophia, St. Catherine University repository; 2017 [accessed April 3, 2023]. Available from: https://sophia.stkate.edu/maed/223.
- Schinske J, Tanner K. Teaching More by Grading Less (or Differently). CBE Life Sci Educ. 2014 Summer;13(2):159-66. doi: 10.1187/cbe.cbe-14-03-0054.
- Rosen MA, DiazGranados D, Dietz AS, et al. Teamwork in healthcare: key discoveries enabling safer, high-quality care. Am Psychol. 2018 May-Jun;73(4):433-450. doi: 10.1037/amp0000298.
- Suskie LA. Assessing student learning: a common sense guide (2nd ed.). San Francisco, CA: John Wiley & Sons, Inc.; 2009.
- Durning SJ, Hemmer PA. Commentary: grading: what is it good for? Acad Med. 2012 Aug;87(8):1002-4. doi: 10.1097/ACM.0b013e31825d0b3a.
- Fazio SB, Torre DM, DeFer TM. Grading practices and distributions across internal medicine clerkships. Teach Learn Med. 2016 Jul-Sep;28(3):286-92. doi: 10.1080/10401334.2016.1164605.
- Alexander EK, Osman NY, Walling JL, Mitchell VG. Variation and imprecision of clerkship grading in U.S. medical schools. Acad Med. 2012 Aug;87(8):1070-6. doi: 10.1097/ACM.0b013e31825d0a2a.
- Ogden PE, Edwards J, Howell M, Via RM, Song J. The effect of two different faculty development interventions on third-year clerkship performance evaluations. Fam Med. 2008 May;40(5):333-8.
- Bland JM, Altman DG. Measuring agreement in method comparison studies. Stat Methods Med Res. 1999 Jun;8(2):135-60. doi: 10.1177/096228029900800204.
- Martell RF, Borg MR. A comparison of the behavioral rating accuracy of groups and individuals. J Appl Psych. 1993;78(1):43-50. doi: https://doi.org/10.1037/0021-9010.78.1.43.
- Kibble JD. Best practices in summative assessment. Adv Physiol Educ. 2017 Mar 1;41(1):110-119. doi: 10.1152/advan.00116.2016.
- Butler R, Nisan M. Effects of no feedback, task-related comments, and grades on intrinsic motivation and performance. J Educ Psychol. 1986;78(3):210-216. doi: https://doi.org/10.1037/0022-0663.78.3.210.
- Crisp BR. Is it worth the effort? How feedback influences students’ subsequent submission of assessable work. Assess Eval High Educ. 2007;32(5):571-581. doi: 10.1080/02602930601116912.