PEER REVIEWED
Demographic Trends in the Optometry School Applicant Pool from 2014-2021
Raymond Chu, OD, MS, FAAO, Kristine Huang, OD, MPH, FAAO
Abstract
This paper describes trends within geography, gender and race/ethnicity in the optometry applicant pool from 2014 through 2021. Demographic data from the Optometry Centralized Application Service was analyzed and compared to applicant pool data for medical and dental school and bachelor’s degree data from the National Center for Education Statistics. The optometry applicant pool reflected patterns in bachelor’s degree conferral data with exception to a higher-than-expected proportion of female applicants and a lower-than-expected proportion of Black applicants. The disparity trends in the optometry applicant pool reflect current recruitment and retention practices, alongside broader societal challenges in education and opportunity distribution during the formative kindergarten through high school education period.
Key Words: applicant pool, race, ethnicity, gender, geography
Background
The higher education system in the United States has a longstanding history of disparities. Before the enactment of Title IX of the Education Amendments of 1972 and Title VI of the Civil Rights Act of 1964, overt discrimination prevented many women and ethnic minorities from attending college, resulting in significant gender and racial disparities among student and faculty bodies.1,2 By 1980, female students surpassed male students for the first time, comprising 52% of undergraduate enrollment; however, White students continued to be the overwhelming majority at 83.5%.3,4 From 2009 to 2019, female students consistently represented 57% of total undergraduate enrollment.5 Similar to the trends in undergraduate institutions, in the 1971-1972 application cycle, only 5% (n=115) of applicants to U.S. schools and colleges of optometry were female.6 However, this proportion steadily increased over the following decades, and by 2010, female applicants comprised 66.8% of the applicant pool.7 Today, female students comprise the majority of matriculants to optometry, medical and dental schools.8–10 Despite this progress in gender equity, disparities persist in terms of ethnicity and race, particularly among Black and Native American ethnic groups. From 2009 to 2019, enrollment of Black undergraduate students fell by 17% (from 14.7% to 13.2% of total undergraduate enrollment), while enrollment of American Indian/Alaska Native dropped by 38% (from 1.0% to 0.7% of total undergraduate enrollment).4,5 Fortunately, the proportion of Black applicants to U.S. schools and colleges of optometry have not experienced a similar decline. It was 5% in the 2009-2010 application cycle and increased slightly to 5.96% during the 2020-2021 application cycle. However, this proportion has remained relatively stagnant and Black applicants continue to be underrepresented relative to the undergraduate and U.S. census population.11,12
Zadnik and Reich reported on academic qualification trends in the overall pool of optometry applicants and matriculants.13 The purpose of this paper is to further explore optometry applicant trends by examining demographic data, specifically focusing on geographic location, gender and race/ethnicity. Furthermore, this study conducts a comparative analysis of these trends to the applicant pools in medical and dental schools, revealing broader patterns within the three health professions.
Methods
The Association of Schools and Colleges of Optometry provided both published and unpublished data from the Optometry Centralized Application Service (OptomCAS).12 The data used for this analysis included each verified applicant’s demographic information during the 2014-2015 through 2020-2021 application cycles.
When examining geographic data, only applicants from the United States and Puerto Rico, as reported by their state of residence, was used. Applicants from other U.S. territories, international applicants and those with an unknown state of residence were not included in this analysis. For gender and race/ethnicity classification, demographic information provided by the applicant was used. Those applicants who did not report race/ethnicity and/or gender were not included in this analysis. For trend analysis and comparison to medical and dental schools, demographic data from the Association of Schools and Colleges of Optometry was compared to applicant data from the Association of American Medical Colleges (MD-Granting Medical Schools only) and the American Dental Education Association.9,10 Additionally, for trends related to geographic location, gender and race/ethnicity, the study compared applicant data from these three health professions to bachelor’s degrees conferral data from the National Center for Education Statistics.14
Results
Geographic Disparities
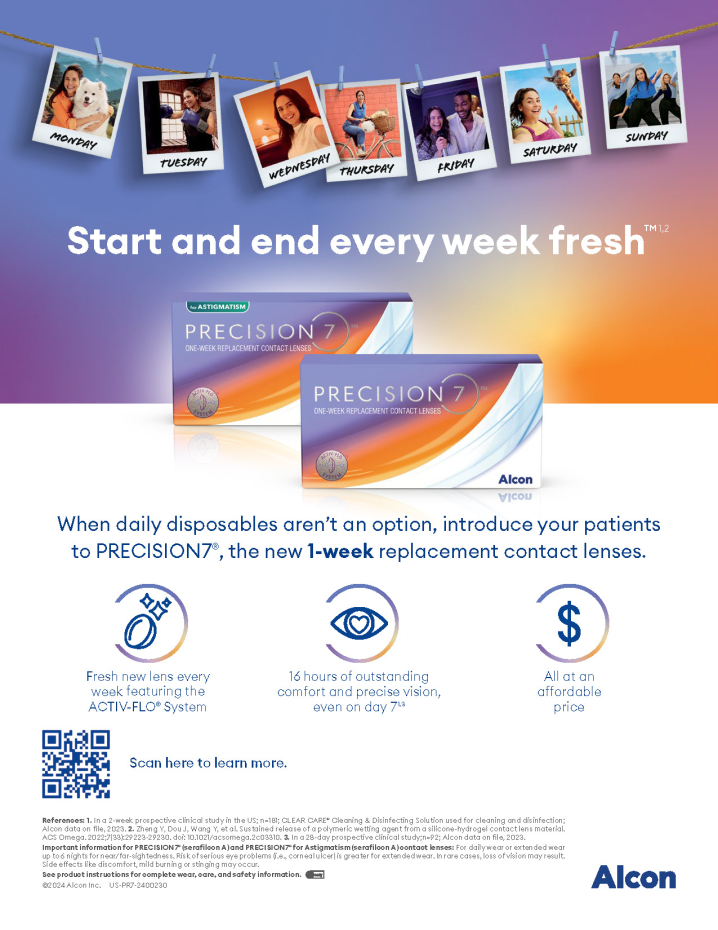
The number of unique applicants from the United States and Puerto Rico as a function of application cycles (2014-2015 through 2020-2021) by state of residence is shown in Table 1. During this period, the mean number of optometry applicants originating from the United States and Puerto Rico was 2408 (standard deviation = 114). The range in the number of applicants showed a high of 2577 applicants during the 2015-2016 cycle and a low of 2242 applicants during the 2018-2019 cycle.
From 2014-2015 through 2020-2021, the states with the largest proportion of optometry applicants were consistently:
- California (average: 15% of the total applicant pool)
- Texas (average: 10% of the total applicant pool)
- Florida (average: 7% of the total applicant pool) and New York (average: 7% of the total applicant pool)
The geographic distribution of applicants to optometry, medical and dental schools during the 2019-2020 application cycle is reported in Table 2. Like the optometry applicant pool, the states where the most applicants to medical and dental schools resided were:
- California (Optometry: 14%, Medical: 12%, Dental: 12%)
- Texas (Optometry: 10%, Medical: 9%, Dental: 9%)
- Florida (Optometry: 7%, Medical: 7%, Dental: 9%)
- New York (Optometry: 6%, Medical: 7%, Dental: 7%)
In 2020, the Association of American Medical Colleges reported that 68.5% of matriculants to MD-granting medical schools had undergraduate majors in biological sciences (57.8%), physical sciences (10.1%) or math and statistics (0.7%).15 Given that graduates in natural sciences and mathematics (including biological and biomedical sciences, physical sciences, science technologies/technicians and mathematics and statistics) are likely to be the majority of potential applicants to optometry, medical or dental schools, Table 2 shows proportional alignment between states with the largest number of bachelor degree recipients in these fields and applicants to optometry, medical and dental schools during the 2019-2020 application cycle and graduation year. The states with the highest distribution of recipients with bachelor’s degree in natural sciences and mathematics were:
- California (13%)
- New York (7%) and Texas (7%)
- Pennsylvania (5%) and Florida (5%)
Table 2 assumes that the year of bachelor’s degree conferral aligns with the application year to either optometry, medical or dental school. While applicants may not necessarily apply to one of the three health professions in the year they graduate, data from the National Center of Education Statistics remains consistent for the years surrounding it.14
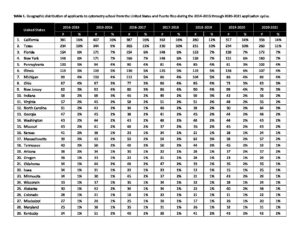 Table 1. Geographic distribution of applicants to optometry school from the United States and Puerto Rico during the 2014-2015 through 2020-2021 application cycles.Click to enlarge |
 Table 2. Geographic distribution of applicants to optometry, medical and dental school from the United States and Puerto Rico during the 2019-2020 application cycle as compared to bachelor’s degree conferred in natural sciences and mathematics during the 2019-2020 academic year. Click to enlarge |
Gender Disparities
Over the six application cycles, from 2014-2015 through 2020-2021, the mean percentage of female applicants to optometry school was 70% (standard deviation = 1.51) (Table 3). The proportion of female applicants remained consistent with a high of 72% female applicants during the 2020-2021 cycle and a low of 67% female applicants during the 2016-2017 cycle.
During the 2019-2020 application cycle (Table 4), the distribution of female applicants to optometry school (71%) surpassed the proportion of female applicants to medical school (53%) and dental school (55%). Assuming the potential applicant pool was represented by the percentage of female bachelor’s degree recipients in biological and biomedical sciences (64%), female optometry applicants (71%) exceeded expectations, while the female applicant pools for medical (53%) and dental (55%) schools were lower than anticipated.
 Table 3. Gender distribution of applicants to optometry school from the United States and Puerto Rico during the 2014-2015 through 2020-2021 application cycles. Click to enlarge |
 Table 4. Gender distribution of all applicants to optometry, medical and dental school during the 2019-2020 application cycle as compared to all bachelor’s degree conferred in biological and biomedical sciences during the 2019-2020 academic year. Click to enlarge |
Racial/Ethnic Disparities
The distribution of race/ethnicity among optometry school applicants from the 2014-2015 through the 2020-2021 application cycles is shown in Table 5. Across these cycles, the racial/ethnic distribution remained unchanged with a substantial portion of the optometry applicant pool composed of White applicants, constituting a mean percentage of 48% (standard deviation = 1.39). This was followed by Asian applicants at 28% (standard deviation = 1.05), Hispanic applicants at 10% (standard deviation = 1.27), Black applicants at 5% (standard deviation = 0.98) and both Pacific Islander and Native American applicants each at <1% (standard error of the mean = 0.11 and 0.09 respectively).
Medical and dental schools had a slightly higher percentage of Black applicants at 8% and 7% respectively, as compared to optometry applicants (5%). When considering bachelor’s degree recipients in biological and biomedical sciences during the 2019-2020 academic year (Table 6), there was an underrepresentation in the expected proportion of applicants within certain ethnic groups, including White and Hispanic. Black applicants were also underrepresented, particularly within the optometry applicant pool. Conversely, there was an overrepresentation in the expected applicants from Asian ethnic groups across all three health programs.
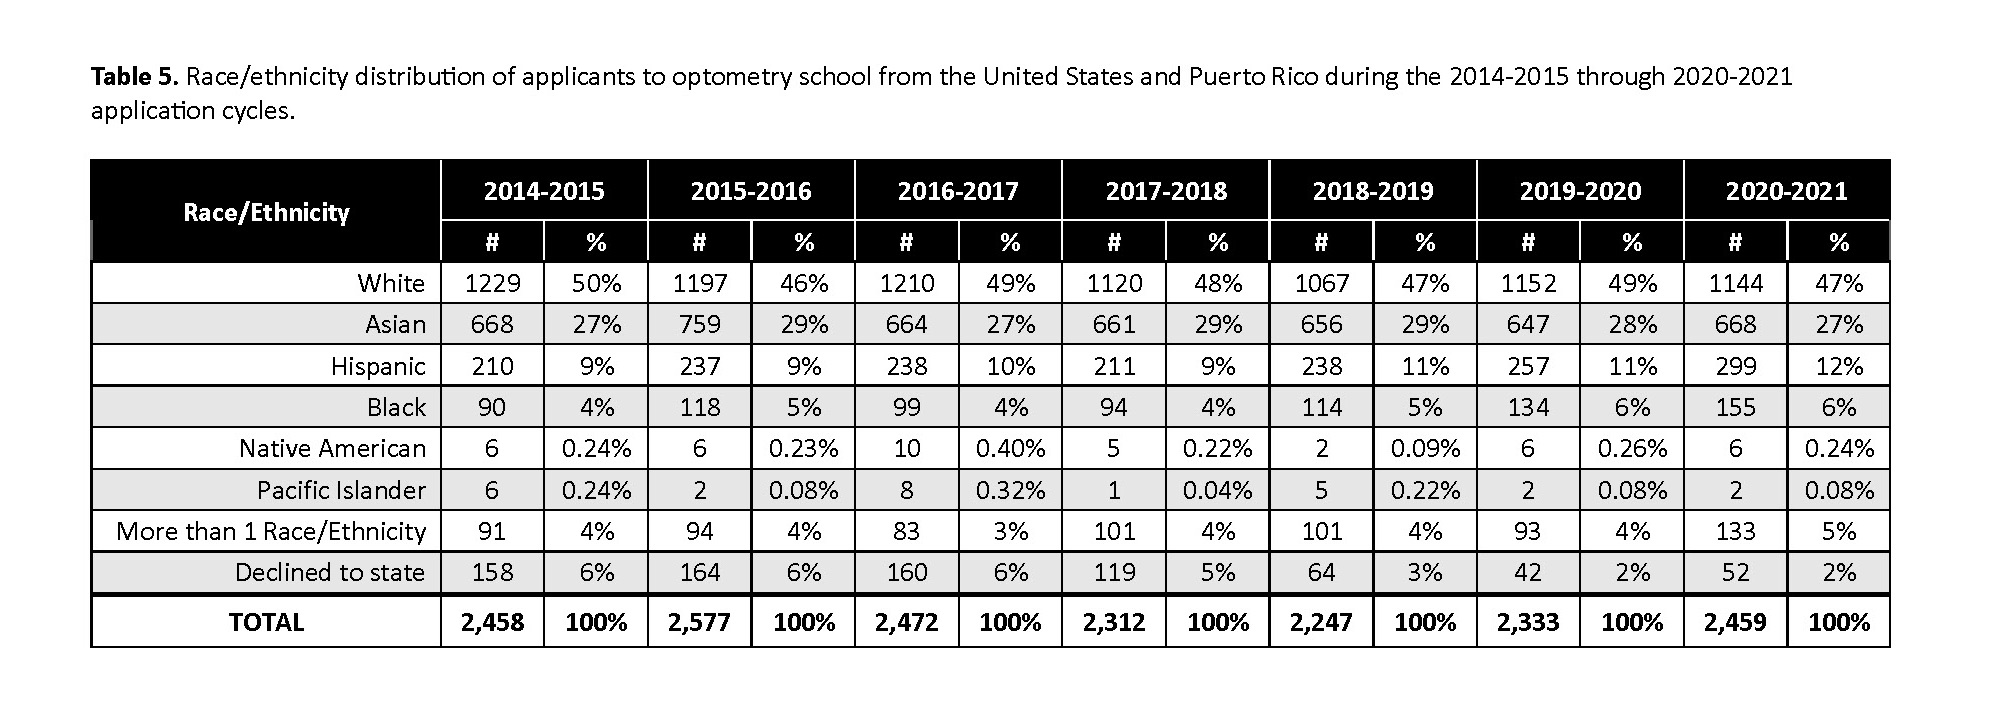 Table 5. Race/ethnicity distribution of applicants to optometry school from the United States and Puerto Rico during the 2014-2015 through 2020-2021 application cycles. Click to enlarge |
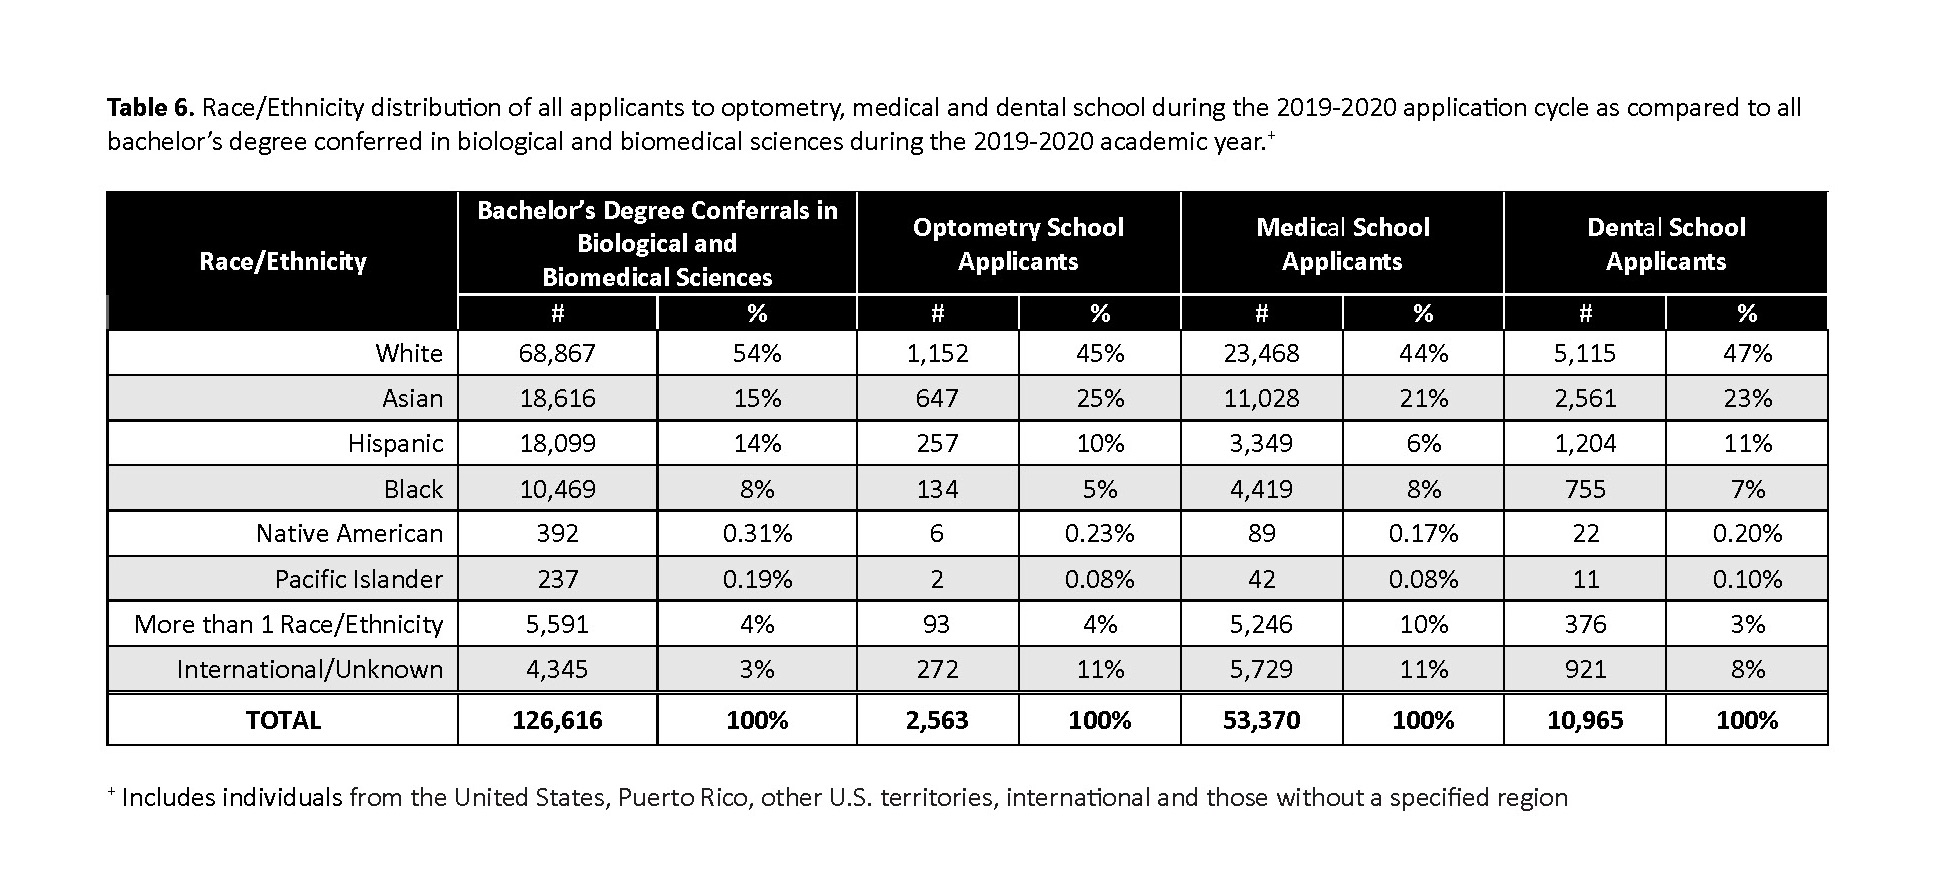 Table 6. Race/Ethnicity distribution of all applicants to optometry, medical and dental school during the 2019-2020 application cycle as compared to all bachelor’s degree conferred in biological and biomedical sciences during the 2019-2020 academic year. Click to enlarge |
Discussion
Improving diversity, equity and inclusion among the healthcare workforce is frequently linked to the delivery of quality healthcare services, especially among underrepresented populations.16,17 Therefore, when examining the current and future supply of healthcare providers, it is crucial to consider diversity within the profession, including factors such as gender, racial and ethnic representation and geographic distribution. Additionally, it is important to explore the root causes of inequitable representation. Chu et al. noted that the path to increasing diversity among doctors of optometry begins with collecting data on diversity among optometry applicants, students and faculty.18
Geographic Disparities
Based on our study, the future supply of optometrists, medical doctors and dentists largely originate from California, Texas, Florida and New York. Despite having the largest proportion of applicants residing in these states, California, Florida and Texas are projected to face some of the most significant physician shortages among all states by 2030.19 The impending national physician shortage has prompted healthcare professions to expand the number of seats and schools. However, this growth has yet to address the maldistribution of primary health care services, which disproportionately afflicts rural and underserved communities.13,20–22 From 1995 to 2017, Feng et al. found that although the overall optometrist density increased from 11.06 to 16.16 optometrists per 100,000 individuals, there continued to be a shortage of eyecare providers in rural counties.23
Although Grobler et al. emphasized the need for greater scientific rigor to more accurately assess interventions influencing physicians’ decision to practice in underserved areas, educational institutions have demonstrated some success in addressing physician shortages in these areas.24 Rabinowitz et al. identified certain physician characteristics as strong predictors for practicing in underserved areas, which include being part of an underrepresented minority group, male gender and foreign language fluency.22 Underrepresented minority physicians were nearly three times more likely to practice in underserved areas.22 Physicians who self-identified as fluent in Spanish or an Asian language had a higher likelihood of practicing in geographic areas with limited English proficiency.25 Verma et al. suggested changes to admissions practices, emphasizing the value of applicants with experiences of growing up in or intending to practice in underserved communities.26 Additionally, the inclusion of experiential training sites in rural or underserved areas (e.g., community health centers, rural health clinics, federally qualified health centers or critical access hospitals) is cited as an effective intervention in influencing future physician practice location.26–28 Quin et al. noted optometric residency training increased both interest to practice within a community health centers and higher placement rates within community health centers among residency-trained alumni.29
Gender Disparities
Compared to engineering and computer science, the healthcare professions of optometry, medicine and dentistry have a greater representation of female health care workers. A 2020 report, Promising Practices for Addressing the Underrepresentation of Women in Sciences, Engineering, and Medicine (STEM), cited structural, cultural, and institutional patterns of bias, discrimination, and inequity as major barriers to the recruitment of women in engineering and technology fields.30 Cheryan et al. proposed a psychosocial model, identifying three key factors as to why female undergraduate students may gravitate towards biological and biomedical sciences and away from majors in engineering, computer and information sciences. These factors include pre-existing stereotypes, insufficient early experiences and self-perception of abilities and skills.31 In a study by Google, pre-college experiences were the most influential factor correlating with young women pursuing a career in computer science.32 During the 2018-2019 academic year, the California Department of Education reported 2.8 times more schools (1,058 versus 376) offered advanced placement (AP) or international baccalaureate (IB) courses in science as compared to computer education within the state.33 Within these courses, female enrollment was 52.8% in science and 34.2% in computer education.33 Similarly, during the 2021-2022 academic year, the New York State Education Department reported a greater number of male students enrolled in AP courses in Computer Science A and Computer Science Principles as compared to female students (6,320 female students versus 10,419 male students) with a greater proportion of male students achieving a 3 or higher on the respective AP exams.34 In fact, the introduction of the AP Computer Science Principles (CSP) course and exam during the 2016-17 academic year was a means of addressing underrepresentation of Black, Hispanic and female students in computer science related college majors.35
The National Academies of Sciences, Engineering and Medicine (NASEM) cited evidence that family friendly policies, including considerations for marriage, family and career interruptions, were effective in the retention and advancement of female professionals in STEM fields.30 Jolly et al. observed that among recipients of K08 and K23 research grants, female physician-researchers reported dedicating an additional 8.5 hours per week to parenting or domestic activities compared to their male counterparts.36 While this example is not exclusive to female physician-scientists, optometry as a profession has made notable strides in fostering workforce equity as compared to other STEM fields. The importance of work-life balance was evident in the 2017 National Optometry Workforce Survey, where both male and female optometrists showed no significant differences in hours worked, weeks worked, productivity or satisfaction regarding career options and professional growth.37 This may contribute to the higher proportion of female applicants and matriculants to optometry school as compared to medical and dental schools.
Racial/Ethnic Disparities
Laurencin and Murray characterized the absence of Black males in medical school as an American crisis, posing a threat to health equity due to the challenge in achieving and sustaining a diverse physician workforce.16 Special interest groups, like Black EyeCare Perspective, have advocated for more representation of Black doctors as a means for addressing racial and ethnic health disparities. In line with this, Mertz et al. found that among underrepresented minority dentists (American Indian/Alaska Natives, Black and Hispanic/Latino), 54.1% of their patient base were racially concordant.17,38
The 2023 Supreme Court ruling on affirmative action has reignited discussion about admissions reform to promote equity among all ethnic groups.39 In July 2018, the University of California examined the use of standardized testing in its admission criteria due to public concerns of potential ethnic bias in the exams.40 While the findings of the task force did not substantiate that claim, the University of California decided in May 2020 to remove the requirement for American College Test (ACT) / Scholastic Aptitude Test (SAT) scores, opting for a more holistic review process.41 In August 2023, the University of California reported its largest class of underrepresented freshmen in its history.42 Similarly, the Medical College Admission Test (MCAT) was reviewed for ethnic bias after findings showed that Black and Latino examinees had lower average scores compared to White examinees. However, this disparity in test performance was attributed to family and neighborhood influences that limited academic opportunities spanning from kindergarten through high school.43
While most medical school admission practices subscribe to the notion that higher MCAT scores predict success on the United States Medical Licensing Examination Step 1 exam, Elks et al. concluded that standardized admission tests were not a fixed attribute.44 Proponents of a holistic admission process advocate for the balanced consideration of academic metrics, along with the evaluation of experiences and attributes, in measuring the potential for academic success.45,46 Bates et al. emphasized that personal attributes and life experiences should be taken into account and aligned with the program’s mission, which embraces a broader concept of diversity beyond just race and ethnicity.47 A holistic admission process combined with a supportive curriculum that included strong faculty-student relationships, opportunities for remediation of poor performing exams during the pre-clinical curriculum, addressing explicitly the necessary study and time-management skills needed, and monitoring of academic progress resulted in student success beyond what would have been predicted based on MCAT scores alone.44
Conclusion
Leila Janah is credited with the quote “Talent is equally distributed, but opportunity is not.”48 Current trends in geographic, gender and racial/ethnic disparities among applicants to optometry, medical and dental schools reflect similar disparities within the undergraduate pipeline. Understanding and addressing these disparities is essential to fostering a more inclusive and diverse healthcare workforce. Future studies should assess the impact of holistic admission practices and interventions aimed at promoting greater diversity, including public awareness campaigns, such as Optometry Gives Me Life, on the optometry applicant pool.49
References
- U.S. Department of Health and Human Services. Title IX of the Education Amendments of 1972. October 27, 2021. Accessed September 27, 2023. https://www.hhs.gov/civil-rights/for-individuals/sex-discrimination/title-ix-education-amendments/index.html#:~:text=Title%20IX%20of%20the%20Education%20Amendments%20of%201972%20(Title%20IX,activity%20receiving%20federal%20financial%20assistance.
- U.S. Department of Health and Human Services. Civil Rights Requirements- A. Title VI of the Civil Rights Act of 1964, 42 U.S.C. 2000d et seq. (“Title VI”). July 26, 2013. Accessed September 27, 2023. https://www.hhs.gov/civil-rights/for-individuals/special-topics/needy-families/civil-rights-requirements/index.html
- National Center for Education Statistics. Total undergraduate fall enrollment in degree-granting postsecondary institutions, by attendance status, sex of student, and control and level of institution: Selected years, 1970 through 2026. https://nces.ed.gov/programs/digest/d16/tables/dt16_303.70.asp
- National Center for Education Statistics. Fall enrollment of U.S. residents in degree-granting postsecondary institutions, by race/ethnicity: Selected years, 1976 through 2031. https://nces.ed.gov/programs/digest/d22/tables/dt22_306.30.asp
- National Center for Education Statistics. Undergraduate Enrollment. Condition of Education. U.S. Department of Education, Institute of Education Sciences; 2023. Accessed September 12, 2023. https://nces.ed.gov/programs/coe/pdf/2021/cha_508c.pdf
- Levine NR, Levine L. A study of applicants to colleges of optometry in the U.S. J Am Optom Assoc. 1976;47(5):616-623.
- Association of Schools and Colleges of Optometry. Gender of doctor of optometry applicants, U.S. schools and colleges of optometry 2008-2023. February 2023. https://optometriceducation.org/wp-content/uploads/2023/01/Applicants-by-Gender.pdf
- Association of Schools and Colleges of Optometry. Proportion of Female Full-Time Doctor of Optometry Students by Year, 2006-2023. May 2023. Accessed September 27, 2023. https://optometriceducation.org/wp-content/uploads/2023/05/Enrollment-Proportion-Female.pdf
- Singh P, Lawton K, Istrate E. U.S. Dental School Applicants and Enrollees, 2022 Entering Class. American Dental Education Association; 2023. Accessed September 23, 2023. https://www.adea.org/data/students/Applicants-2022-Entering-Class/
- Association of American Medical Colleges. Applicants to U.S. Medical Schools by Gender, 1980-1981 through 2022-2023. October 24, 2022. Accessed September 27, 2023. https://www.aamc.org/media/9586/download?attachment
- Association of Schools and Colleges of Optometry. OptomCAS Applicant Data Report – A National Snapshot 2009-2010. Accessed September 27, 1927. https://www.optomcas.org/wp-content/uploads/2022/04/OptomCAS-Applicant-Data-Report-2020-2021.pdf
- Association of Schools and Colleges of Optometry. OptomCAS Applicant Data Report – A National Snapshot 2020-2021. Accessed September 27, 2023. https://www.optomcas.org/wp-content/uploads/2022/04/OptomCAS-Applicant-Data-Report-2020-2021.pdf
- Zadnik K, Reich LN. An Analysis of the Optometric Applicant Pool Relative to Matriculants. Optom Vis Sci. 2019;96(9):637-646. doi:10.1097/OPX.0000000000001424
- National Center for Education Statistics. Digest of Education Statistics. Accessed September 26, 2023. https://nces.ed.gov/programs/digest/2022menu_tables.asp
- Murphy B. Which undergrad majors are best for med school? Which undergrad majors are best for med school? May 27, 2021. Accessed July 25, 2024. https://www.ama-assn.org/medical-students/preparing-medical-school/which-undergrad-majors-are-best-med-school
- Laurencin CT, Murray M. An American Crisis: The Lack of Black Men in Medicine. J Racial Ethn Health Disparities. 2017;4(3):317-321. doi:10.1007/s40615-017-0380-y
- Black EyeCare Perspective. The 13% Promise. Accessed September 23, 2023. https://blackeyecareperspective.com/the-13-promise
- Chu G, Kalaczinski L, Russo D, Leasher J, Elder K, Fink B. Diversity in our Colleges and Schools of Optometry. Optom Educ. 2017;43(1). https://journal.opted.org/article/diversity-in-our-colleges-and-schools-of-optometry/
- Zhang X, Lin D, Pforsich H, Lin VW. Physician workforce in the United States of America: forecasting nationwide shortages. Hum Resour Health. 2020;18(1):8. doi:10.1186/s12960-020-0448-3
- Boyle P. Medical school enrollments grow, but residency slots haven’t kept pace. September 3, 2020. Accessed October 2, 2023. https://www.aamc.org/news/medical-school-enrollments-grow-residency-slots-haven-t-kept-pace#:~:text=To%20address%20concerns%20about%20the,%2C%20which%20was%202002%2D03.
- Gibson DM. The geographic distribution of eye care providers in the United States: Implications for a national strategy to improve vision health. Prev Med. 2015;73:30-36. doi:10.1016/j.ypmed.2015.01.008
- Rabinowitz HK, Diamond JJ, Markham FW, Santana AJ. The relationship between entering medical students’ backgrounds and career plans and their rural practice outcomes three decades later. Acad Med. 2012;87(4):493-497. doi:10.1097/ACM.0b013e3182488c06
- Feng PW, Ahluwalia A, Feng H, Adelman RA. National Trends in the United States Eye Care Workforce from 1995 to 2017. Am J Ophthalmol. 2020;218:128-135. doi:10.1016/j.ajo.2020.05.018
- Grobler L, Marais BJ, Mabunda S. Interventions for increasing the proportion of health professionals practising in rural and other underserved areas. The Cochrane Collaboration, ed. Cochrane Database Syst Rev. 2015;(6). doi:10.1002/14651858.CD005314.pub3
- Moreno G, Walker KO, Morales LS, Grumbach K. Do Physicians with Self-Reported Non-English Fluency Practice in Linguistically Disadvantaged Communities? J Gen Intern Med. 2011;26(5):512-517. doi:10.1007/s11606-010-1584-6
- Verma P, Ford JA, Stuart A, Howe A, Everington S, Steel N. A systematic review of strategies to recruit and retain primary care doctors. BMC Health Serv Res. 2016;16:126. doi:10.1186/s12913-016-1370-1
- Goodfellow A, Ulloa JG, Dowling PT, et al. Predictors of Primary Care Physician Practice Location in Underserved Urban or Rural Areas in the United States: A Systematic Literature Review. Acad Med J Assoc Am Med Coll. 2016;91(9):1313-1321. doi:10.1097/ACM.0000000000001203
- Lapidus A, Shah S, Mekonnen M, et al. Medical student intentions to practice internal medicine in underserved areas associated with debt, identity and extracurricular participation. BMC Med Educ. 2023;23(1):420. doi:10.1186/s12909-023-04392-0
- Quinn N, Keppol S, Bligdon S, Lyons S. Impact of Optometric Residency Training on Future Career Paths: A Survey of Perceptions of Optometry Students, Residents and Alumni. Optom Educ. 2015;40(2):94-103.
- Committee on Increasing the Number of Women in Science, Technology, Engineering, Mathematics, and Medicine (STEMM), Committee on Women in Science, Engineering, and Medicine, Policy and Global Affairs, National Academies of Sciences, Engineering, and Medicine. Promising Practices for Addressing the Underrepresentation of Women in Science, Engineering, and Medicine: Opening Doors. (Colwell R, Bear A, Helman A, eds.). National Academies Press; 2020:25585. doi:10.17226/25585
- Cheryan S, Ziegler SA, Montoya AK, Jiang L. Why are some STEM fields more gender balanced than others? Psychol Bull. 2017;143(1):1-35. doi:10.1037/bul0000052
- Google. Women Who Choose Computer Science— What Really Matters. May 26, 2014. Accessed July 25, 2024. https://static.googleusercontent.com/media/edu.google.com/en//pdfs/women-who-choose-what-really.pdf
- California Department of Education, Data Reporting Office. Course Enrollment Listing 2018-19. Accessed August 17, 2024. https://dq.cde.ca.gov/dataquest/CourseReports/CourseResults.aspx?Filter=A&TheYear=2018-19&cTopic=Course&cChoice=CrseEnroll&cLevel=State&cdscode=00000000000000&Subject=N&AP=Y&IB=Y&CTE=N&lNotAll=True
- New York State Education Department. NY State 2021-22 AP/IB Report. Accessed October 31, 2024. https://data.nysed.gov/APIB.php?state=yes&year=2022&createreport=1
- Wyatt J, Feng J, Ewing M. AP® Computer Science Principles and the STEM and Computer Science Pipelines. December 2020. Accessed October 31, 2024. https://apcentral.collegeboard.org/media/pdf/ap-csp-and-stem-cs-pipelines.pdf
- Jolly S, Griffith KA, DeCastro R, Stewart A, Ubel P, Jagsi R. Gender differences in time spent on parenting and domestic responsibilities by high-achieving young physician-researchers. Ann Intern Med. 2014;160(5):344-353. doi:10.7326/M13-0974
- Heath DA, Spangler JS, Wingert TA, et al. 2017 National Optometry Workforce Survey. Optom Vis Sci. 2021;98(5):500-511. doi:10.1097/OPX.0000000000001688
- Mertz EA, Wides CD, Kottek AM, Calvo JM, Gates PE. Underrepresented Minority Dentists: Quantifying Their Numbers And Characterizing The Communities They Serve. Health Aff Proj Hope. 2016;35(12):2190-2199. doi:10.1377/hlthaff.2016.1122
- Supreme Court of the United States. Students For Fair Admissions, Inc. v. President and Fellows of Harvard College and Students For Fair Admissions, Inc. v. University of North Carolina, et al. June 29, 2023. Accessed September 28, 2023. https://www.supremecourt.gov/opinions/22pdf/20-1199_hgdj.pdf
- Academic Senate University of California. Report of the UC Academic Council Standardized Testing Task Force (STTF); 2020. Accessed September 25, 2023. https://senate.universityofcalifornia.edu/_files/underreview/sttf-report.pdf
- UC Office of the President. University of California Board of Regents unanimously approved changes to standardized testing requirement for undergraduates. May 21, 2020. Accessed September 28, 2023. https://www.universityofcalifornia.edu/press-room/university-california-board-regents-unanimously-approved-changes-standardized-testing
- UC Office of the President. University of California admits record number of California residents and largest class of underrepresented freshmen in system history for fall 2023. August 8, 2023. Accessed September 24, 2023. https://www.universityofcalifornia.edu/press-room/university-california-admits-record-number-california-residents-and-largest-class
- Davis D, Dorsey JK, Franks RD, Sackett PR, Searcy CA, Zhao X. Do racial and ethnic group differences in performance on the MCAT exam reflect test bias? Acad Med. 2013;88(5):593-602. doi:10.1097/ACM.0b013e318286803a
- Elks ML, Herbert-Carter J, Smith M, Klement B, Knight BB, Anachebe NF. Shifting the Curve: Fostering Academic Success in a Diverse Student Body. Acad Med J Assoc Am Med Coll. 2018;93(1):66-70. doi:10.1097/ACM.0000000000001783
- Conrad SS, Addams AN, Young GH. Holistic Review in Medical School Admissions and Selection: A Strategic, Mission-Driven Response to Shifting Societal Needs. Acad Med. 2016;91(11):1472-1474. doi:10.1097/ACM.0000000000001403
- Addams AN, ed. Roadmap to Excellence: Key Concepts for Evaluating the Impact of Medical School Holistic Admissions. First edition. Association of American Medical Colleges; 2013.
- Bates T, Mutha S, Coffman J. Practicing Holistic Review in Medical Education. July 2020. Accessed July 25, 2024. https://healthforce.ucsf.edu/sites/healthforce.ucsf.edu/files/publication-pdf/Practicing%20Holistic%20Review%20in%20Medical%20Education_102220.pdf
- Samasource Impact Sourcing, Inc. About Our Founder. Accessed September 24, 2023. https://www.sama.com/our-story/#:~:text=She%20founded%20Sama%20in%202008,60%2C000%20people%20out%20of%20poverty
- Association of Schools and Colleges of Optometry. ASCO Broadens Public Awareness of Optometry with New ‘Optometry Gives Me Life’ Campaign. March 12, 2019. Accessed September 1, 2023. https://optometriceducation.org/news/asco-broadens-public-awareness-of-optometry-with-new-optometry-gives-me-life-campaign/