PEER REVIEWED
Racial and Ethnic Diversity Trends
in Optometry and Ophthalmology Residency Training Programs: a 2-year Review
Shital Mani, OD, FAAO, Diane Russo, OD, MPH, MBA, FAAO, and Nicole Quinn, OD, FAAO
Abstract
The United States population increased in diversity in the past decade with nearly 40% of residents reporting race/ethnicity other than White. Recent studies indicate a large gap in racial/ethnic diversity in healthcare occupations with lower proportions of under-represented minority (URM) groups, especially among eyecare professionals. Understanding diversity trends in residency programs is essential to improving access to high quality eye care. The primary study goal was to determine whether there are differences in racial/ethnic representation among optometry and ophthalmology residents. Data analysis showed a disparity of URM resident trainees in both groups. Continued efforts to reduce gaps in diversity of eyecare professionals are necessary to improve racial, ethnic and cultural concordance among patients and their physicians.
Key Words: race, ethnicity, optometry, ophthalmology, residents, diversity, trends
Background
The population of the United States of America is becoming increasingly diverse. According to 2020 Census data, approximately 40% of the population reports race or ethnicity other than White alone.1 Recent studies indicate that racial and ethnic diversity in healthcare occupations does not mirror this trend.2,3 An increasing amount of evidence suggests that racial, ethnic and cultural concordance between patients and their physicians fosters positive patient experiences by building better trust and communication and healthy doctor-patient relationships.4,5 Additional benefits of increasing racial and ethnic diversity among healthcare professionals include improved healthcare quality and better access to care among underserved populations, which can further lower the overall cost of healthcare delivery.6-8 Therefore, it is imperative that increased measures are taken to diversify the healthcare workforce. In healthcare academic settings, robust URM representation among faculty and staff could attract a more diverse pool of student applicants. An increase in diversity of students enrolled in healthcare training programs may lead to greater cultural competency, which would then allow trainees to better serve the healthcare needs of an ever-growing diverse population.9
To increase racial and ethnic diversity in the healthcare workforce, individuals from URM backgrounds must enroll in healthcare training programs. Recent efforts to report diversity in healthcare training programs indicate that there continues to be lower proportions of URM groups than would be expected based on population demographics, including enrollment in optometry school and ophthalmology residency programs.2,10,11 For example, Census data indicate that in 2020, approximately 12.4% of the general population identified as Black or African American.12 That year, only 1.7% of practicing optometrists and 3.3% of optometry students in the United States identified as Black or African American.13 In addition, ophthalmology training programs have lower numbers of URM residents than many other medical subspecialties.11 Understanding and acknowledging the diversity trends in optometry and ophthalmology training programs is essential in creating strategies to improve access to high quality eye care for all members of the U.S. population.
Until recently, race and ethnicity data were not collected for individuals enrolling in optometric residency programs. Because residency training is commonly required for individuals pursuing careers in optometric education, a better understanding of the representation of URM populations entering optometric residency training is essential in planning future strategies to increase diversity of eyecare professionals. The primary goal of this study was to determine whether there are differences intraprofessionally (within optometry or ophthalmology only) or interprofessionally (comparing optometry and ophthalmology) in racial/ethnic representation among residents in optometry (OD) and ophthalmology (MD/DO) programs. A secondary goal of this study was to determine whether data collection for optometric residency programs is accurately capturing the intended information.
Methods
This study was conducted under exempt status granted by Salus University and did not constitute human subject research.
Data collection
The self-reported data for racial/ethnic identities of optometry residents for the 2019-2020 and 2020-2021 academic years were obtained from the Optometry Residency Match (ORMatch).14 The self-reported data for racial/ethnic identities of ophthalmology residents (medical and osteopathic) for the 2019-2020 and 2020-2021 academic years were extracted from the publicly available Data Resource Book published yearly by the Accreditation Council for Graduate Medical Education (ACGME).15 Racial/ethnicity data on the U.S. population were obtained from the 2020 U.S. Census.20 The Census collected race and ethnicity data using a two-part required questionnaire. One questionnaire part specifically asked for an individual’s race, and a second part asked for Hispanic or Latino origin. The racial/ethnic category designations differed slightly between each of the data sources.
Statistical analysis
A descriptive analysis of the data was performed. Racial and ethnic categories were compared between the optometry and ophthalmology data for each year, 2019-2020 and 2020-2021. Differences for each category, where similarities between datasets existed, were calculated intraprofessionally and interprofessionally. In the intraprofessional difference comparison, a number deviating from zero demonstrated a difference in the percentage of URM residents between 2019-2020 and 2020-2021 within optometry and ophthalmology. In the interprofessional comparison, a number deviating from zero demonstrated a difference in the percentage of optometry and ophthalmology residents in that year. The interprofessional differences were calculated by subtracting the ophthalmology percentage from the optometry percentage.
Racial and ethnic category totals for the optometry and ophthalmology data were also compared to the 2020 U.S. Census data.
Results
The racial/ethnic categories used by both ORMatch and ACGME were American Indian or Alaska Native, Asian, Black or African American, Hispanic, Latino or of Spanish Origin, Native Hawaiian or Other Pacific Islander, White, Other, and Unknown (Table 1, Figure 1). In the 2019-2020 academic year, the number (percentage) of optometry residents in those categories were as follows: 0 (0%), 109 (28.4%), 10 (2.6%), 25 (6.5%), 1 (0.3%), 206 (53.6%), 0 (0%) and 33 (8.6%). In the 2019-2020 academic year, the number (percentage) of ophthalmology residents in those categories were as follows: 2 (0.1%), 371 (24.5%), 32 (2.1%), 61 (4%), 1 (0.1%), 760 (50.3%), 93 (6.2%) and 192 (12.7%).

Figure 1. Click to enlarge
In the 2020-2021 academic year, the number (percentage) of optometry residents in those categories were as follows: 4 (1%), 111 (28%), 20 (5%), 30 (7.6%), 4 (1%), 193 (48.6%), 0 (0%) and 35 (8.8%). In the 2020-2021 academic year, the number (percentage) of ophthalmology residents in those categories were as follows: 1 (0.1%), 473 (30.9%), 35 (2.3%), 108 (7.1%), 1 (0.1%), 789 (51.5%), 32 (2.1%) and 32 (2.1%).
In the 2020-2021 academic year, the ACGME data included an additional category unique to only that dataset: Multiple Race/Ethnicity. The number (percentage) of ophthalmology residents in this category was 60 (3.9%).
Intraprofessional differences were calculated for both the optometry and ophthalmology data from 2019-2020 to 2020-2021. Findings are listed in Table 2 in columns labeled OD-OD Diff 20-21 and OMD-OMD Diff 20-21.
Interprofessional differences were calculated between the optometry and ophthalmology data where each racial/ethnic category was the same for both years of data. The summary of these findings is listed in Table 2 in the columns labeled OD-OMD Diff 2020 and OD-OMD Diff 2021.
The 2020 Census collected race and ethnicity data using a two-part questionnaire, which allowed an individual to choose a race and also identify as of Hispanic or Latino origin. There was a total of six single-race categories: White, Black or African American, American Indian or Alaska Native, Asian, Native Hawaiian or Other Pacific Islander, and Some Other Race.21 If an individual chose two or more races, they were categorized in the “Multiracial” population. For ethnicity, there were two categories: Hispanic or Latino and Not Hispanic or Latino. The largest race/ethnicity group was White alone (61.6%), followed by Hispanic or Latino (18.7%), Black or African American alone (12.4%), two or more races (10.2%), Some Other Race alone (8.4%), Asian alone (6%), American Indian/Alaska Native alone (1.1%) and Native Hawaiian/Pacific Islander alone (0.2%) (Figure 1).
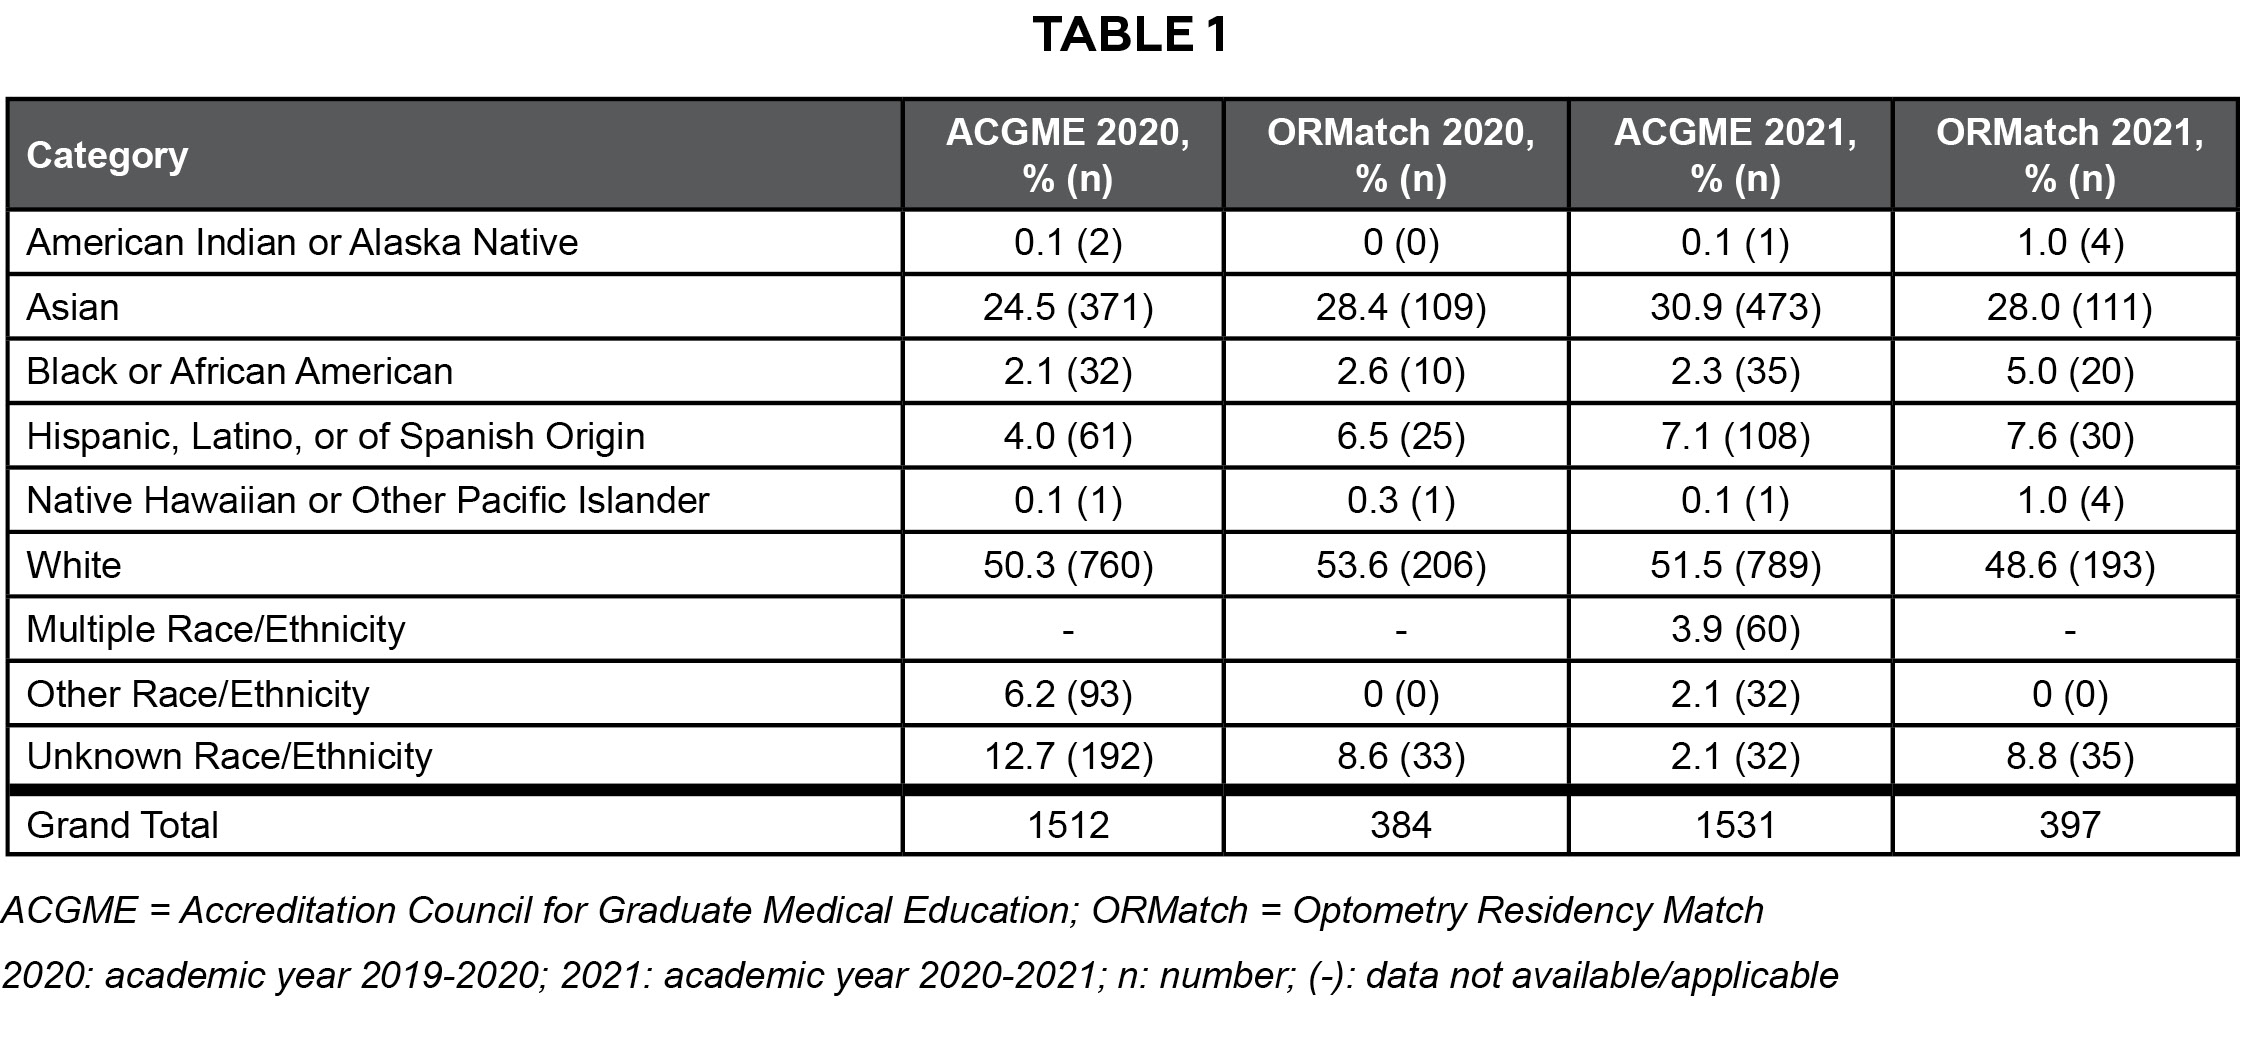 Table 1. Click to enlarge |
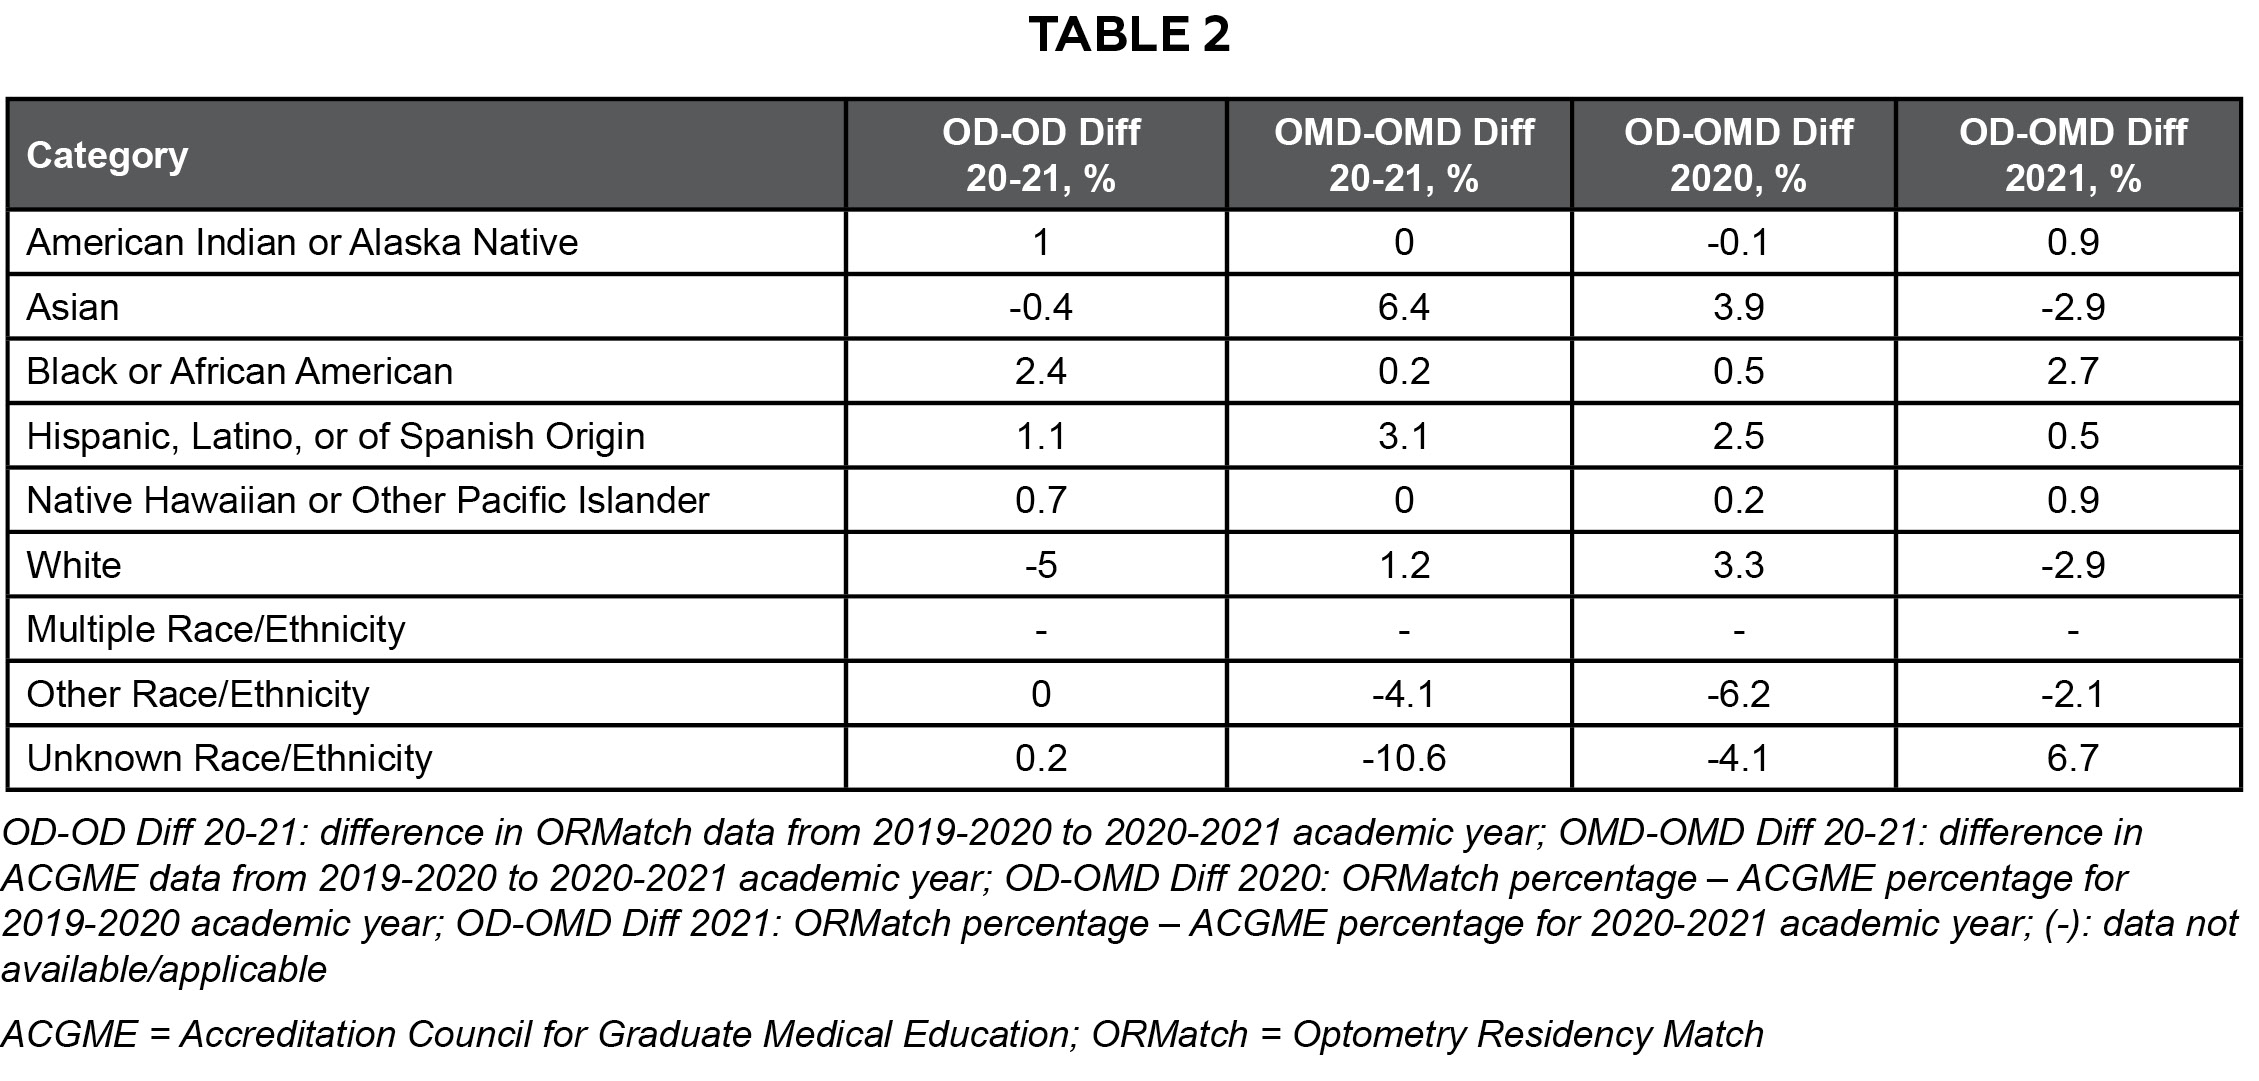 Table 2. Click to enlarge |
Discussion
It has been firmly established that racial and ethnic disparities exist across most, if not all, medical specialties. It is known from prior reports that having a more diverse medical workforce translates to overall better access to health care, increased cultural competency within the workplace, and ultimately better health outcomes for the general population.6,16,17 Studies indicate there are fewer practicing physicians in communities where high proportions of racial and ethnic minorities reside.7 The physicians who serve these communities are more likely to be URM physicians, and URM physicians are more likely to care for patients of their racial or ethnic group.6,7 According to Marrast et al., non-White physicians care for 53.5% of minority and 70.4% of non-English-speaking patients.6 These trends indicate that increasing the number of practicing URM physicians may increase access to health care for URM patients, potentially decreasing the healthcare disparities in these populations.
Recent research indicates that racial and ethnic diversity may be decreasing in academic clinical medicine.16 It is thought that perhaps this decline is due to inability of academic institutions to recruit and/or retain URM faculty due to factors such as lower compensation, biases in the hiring processes, and/or lack of advancement of existing URM faculty via promotion. The proportion of ethnic and racial diversity in medicine has also been seen to decrease with increasing academic rank.18 These trends, as well as low numbers of faculty identifying as URM in ophthalmology19 and optometry, may be a barrier to recruitment of URM into eyecare professions. Although mentorship and networking programs have been successful at increasing racial and ethnic diversity in U.S. medical residency programs,3 further efforts to expand these opportunities should be considered in order to make substantive progress in creating a more diverse healthcare workforce in the eyecare professions.
The data presented in this review indicate that racial/ethnic representation among residents within optometry and ophthalmology residency programs varies from year to year in both professions. A limited dataset is available for optometry resident race and ethnicity, as this information has been collected by ORMatch since only 2019-2020 and published by the Association of Schools and Colleges of Optometry since academic year 2021-22. The optometry data from 2019-2020 to 2020-2021 (Table 2 OD-OD Diff 20-21) demonstrated an increase in residents for the American Indian or Alaska Native, Black or African American, and Hispanic, Latino, or of Spanish Origin categories. There was little to no change for the Asian, Native Hawaiian or Other Pacific Islander, Other Race/Ethnicity, and Unknown Race/Ethnicity categories. Lastly, there was a decrease in the White category. ACGME annual race and ethnicity data describing matched ophthalmology residents also indicated disparities in URM representation in ophthalmology residents for 2019-2020 and 2020-2021. Ophthalmology resident data from 2019-2020 to 2020-2021 (Table 2 OMD-OMD Diff 20-21) showed an increase in the Asian, Hispanic, Latino, or of Spanish Origin, and White categories, little to no change in the American Indian or Alaska Native, Black or African American, and Native Hawaiian or Other Pacific Islander categories, and a decrease in the Other Race/Ethnicity and Unknown Race/Ethnicity categories.
The interprofessional difference (OD-OMD Diff columns of Table 2) comparison showed a fairly stable number of residents in the categories of American Indian or Alaska Native and Native Hawaiian or Other Pacific Islander, but both were very small in number and percentage. Larger shifts were seen in nearly every other category. The shift in the Asian category was due to the increase in ophthalmology residents during the 2020-2021 year while the optometry resident population remained nearly unchanged. Variations for the White category were due to a relatively flat population of ophthalmology residents and a decrease in the percentage of White optometry residents in the 2020-2021 year. In 2019-2020, optometry and ophthalmology had similar percentages in the category of Black or African American, but optometry saw an increase in the next year. The opposite was true for the category of Hispanic, Latino, or of Spanish Origin where optometry had a higher percentage of residents in 2019-2020 and both professions had similar percentages in 2020-2021. The remaining differences in the categories of Other Race/Ethnicity and Unknown Race/Ethnicity showed more variability, which can be attributed to an additional category of Multiple Race/Ethnicity in the ophthalmology-only data, causing a skew in these categories.
The proportion of URM groups in optometry and ophthalmology does not reflect the racial composition of the U.S. population. In addition, the categories utilized by different organizations collecting race/ethnicity data are not consistent. The data collection improvements made by the U.S. Census Bureau from 2010 to 2020 demonstrate the importance of including two or more races to accurately capture the racial and ethnic distribution in the United States. This yielded a better analysis of the diversity profile, specifically pertaining to race and Hispanic origin, to reveal that the U.S. population is indeed more multiracial or multiethnic than initially thought. The 2020 race and ethnicity data showed that the two-part questionnaire allowed for a more authentic representation of how the U.S. population self-identifies. The largest gain noted was in the Multiracial population, which increased by 276% from 2010 to 2020.20-21 The Hispanic or Latino population grew from 16.3 % of the U.S. population in the 2010 Census to 18.7% in the 2020 Census. The Black or African American alone population remained somewhat stationery at 12.6% in 2010 to 12.4% in 2020. However, the Black or African American population in combination with another race such as White or Asian grew by 88.7% from the 2010 Census. Overall, all races in combination with another group, i.e., Multiracial, were captured more accurately and showed an increase over the race-alone categories when compared with 2010 Census data. Efforts to further improve the next decennial Census include utilizing a single combined question for race and ethnicity, which the Census Bureau believes will enable an even more accurate representation of how the U.S. population self-identifies.
There were a few limitations to this study. The first, which impacted the ability to perform a statistical analysis, was the size of the datasets. Due to the low number of individuals contained in some of the racial/ethnic category groups (< 5), a valid analysis could not be conducted with each individual category. This limited the ability to conduct and interpret the statistical analysis without combining groups. Second, the racial/ethnic categories between the ACGME and ORMatch data were not the same for the 2020-2021 year, which limited some of the direct comparisons that could otherwise be made. Third, the ORMatch data did not include individuals who matched in the post-match process, leading to an incomplete representation of the optometry residency data. Lastly, this study only utilized 2 years of data, which limited the ability to evaluate longitudinal trends and draw conclusions about diversity among each of the professions and comparatively.
Based on these findings, the following recommendations may assist in further determining the race and ethnicity trends among ophthalmology and optometry residents:
- Use consistent categories in both professions for collecting race/ethnicity data
- Allow choosing of multiple racial/ethnic categories for the ORMatch data to accurately and specifically document those who identify as mixed race, rather than using the category of “More than One Race” or “Multiple Race/Ethnicity”
- Include race/ethnicity post-match data in the ORMatch published data
Conclusion
As the U.S. population becomes more diverse, there is value in evaluating the current racial/ethnic trends in healthcare trainees. These trainees will go on to become the workforce providing much needed health care to an aging and more racially diverse population. Thoughtful consideration must be given to establishing measures that attract URM students and residents to consider pursuing subspecialties in which there are diversity gaps. Eyecare professions have significant URM under-representation in both clinical and academic medicine. Continued efforts to evaluate existing URM representation in eye care and measures to improve gaps in the diversity of eyecare professionals are not only required but necessary for the future visual well-being of our increasingly diverse nation. To our knowledge, this study is the first of its kind to compare the racial/ethnic diversity trends among optometry and ophthalmology residents. Future reports that include longitudinal data and consistent use of racial/ethnicity categories will allow for better understanding of URM representation in optometry and ophthalmology and inform diversity initiatives related to eyecare professionals.
Acknowledgments
The authors thank Greta Bunin, PhD, for guidance with interpretation and statistical analysis of the study data.
References
- QuickFacts United States [Internet]. United States Census Bureau; July 1, 2022 [accessed Aug 2022]. Available from: https://www.census.gov/quickfacts/fact/table/US/PST045222
- Salsberg E, Richwine C, Westergaard S, et al. Estimation and comparison of current and future racial/ethnic representation in the US health care workforce. JAMA Netw Open. 2021 Mar 1;4(3):e213789. doi: 10.1001/jamanetworkopen.2021.3789
- Butler PD, Fowler JC, Meer E, Rosen IM, Reyes IM, Berns JS. A blueprint for increasing ethnic and racial diversity in U.S. residency training programs. Acad Med. 2022 Nov 1;97(11):1632-1636. doi: 10.1097/ACM.0000000000004847
- Schoenthaler A, Ravenell J. Understanding the patient experience through the lenses of racial/ethnic and gender patient-physician concordance. JAMA Netw Open. 2020 Nov 2;3(11):e2025349. doi: 10.1001/jamanetworkopen.2020.25349
- Takeshita J, Wang S, Loren AW, et al. Association of racial/ethnic and gender concordance between patients and physicians with patient experience ratings. JAMA Netw Open. 2020 Nov 2;3(11):e2024583. doi: 10.1001/jamanetworkopen.2020.24583
- Marrast LM, Zallman L, Woolhandler S, Bor DH, McCormick D. Minority physicians’ role in the care of underserved patients: diversifying the physician workforce may be key in addressing health disparities. JAMA Intern Med. 2014 Feb 1;174(2):289-91. doi: 10.1001/jamainternmed.2013.12756
- Komaromy M, Grumbach K, Drake M, et al. The role of black and Hispanic physicians in providing health care for underserved populations. N Engl J Med. 1996 May 16;334(20):1305-10. doi: 10.1056/NEJM199605163342006
- Jetty A, Jabbarpour Y, Pollack J, Huerto R, Woo S, Petterson S. Patient-physician racial concordance associated with improved healthcare use and lower healthcare expenditures in minority populations. J Racial Ethn Health Disparities. 2022 Feb;9(1):68-81. doi: 10.1007/s40615-020-00930-4
- Gurin P, Dey E, Hurtado S, Gurin G. Diversity and higher education: theory and impact on educational outcomes. Harvard Educational Review. 2002 Sept; 72(3):330-366.
- Chu GY, Kalaczinski L, Russo D, Leasher J, Elder K, Fink B. ASCO special report. Diversity in our colleges and schools of optometry. Optometric Education. 2017 Fall;43(1).
- Atkuru A, Lieng MK, Emami-Naeini P. Trends in racial diversity among United States ophthalmology residents. Ophthalmology. 2022 Aug;129(8):957-959. doi: 10.1016/j.ophtha.2022.03.020
- Optometrists [Internet]. Deloitte and Datawheel [accessed Dec 2022]. Available from: https://datausa.io/profile/soc/optometrists
- Race/Ethnicity of Full-Time Doctor of Optometry Students, 2007-2022. U.S. Schools and Colleges of Optometry (Regular Programs) [Internet]. Rockville, MD: Association of Schools and Colleges of Optometry [accessed Dec 2022]. Available from: https://optometriceducation.org/wp-content/uploads/2022/05/Enr-Race-.pdf
- ORMatch Statistics. Race and Ethnicity of Registered Applicants [Internet]. National Matching Services Inc.; c2024 [accessed Dec 2022]. Available from: https://natmatch.com/ormatch/statistics.html
- ACGME Data Resource Book 2019-2022 [Internet]. Chicago, IL: Accreditation Council for Graduate Medical Education; c2020-2024 [accessed Dec 2022]. Available from: http://www.acgme.org/About-Us/Publications-and-Resources/Graduate-Medical-Education-Data-Resource-Book
- Lett E, Orji WU, Sebro R. Declining racial and ethnic representation in clinical academic medicine: A longitudinal study of 16 US medical specialties. PLoS One. 2018 Nov 16;13(11):e0207274. doi: 10.1371/journal.pone.0207274
- Aguwa UT, Srikumaran D, Brown N, Woreta F. Improving racial diversity in the ophthalmology workforce: a call to action for leaders in ophthalmology. Am J Ophthalmol. 2021 Mar;223:306-307. doi: 10.1016/j.ajo.2020.10.007
- Sanchez AN, Martinez CI, Stampas A, et al. Ethnic and racial diversity in academic physical medicine and rehabilitation compared with all other medical specialties. Am J Phys Med Rehabil. 2021 Feb 1;100(2S Suppl 1):S12-S16. doi: 10.1097/PHM.0000000000001486
- Fairless EA, Nwanyanwu KH, Forster SH, Teng CC. Ophthalmology departments remain among the least diverse clinical departments at United States medical schools. Ophthalmology. 2021 Aug;128(8):1129-1134. doi: 10.1016/j.ophtha.2021.01.006
- Race and Ethnicity in the United States: 2010 Census and 2020 Census [Internet]. United States Census Bureau; Aug 12, 2021 [accessed Aug 2023]. Available from: https://www.census.gov/library/visualizations/interactive/race-and-ethnicity-in-the-united-state-2010-and-2020-census.html
- Jones N, Marks R, Ramirez R, Rios-Vargas M. 2020 Census Illuminates Racial and Ethnic Composition of the Country [Internet]. United States Census Bureau; Aug 12, 2021 [accessed Aug 2023]. Available from: https://www.census.gov/library/stories/2021/08/improved-race-ethnicity-measures-reveal-united-states-population-much-more-multiracial.html