PEER REVIEWED
Optometric Peer Chart Review for Quality Assurance in an Academic Healthcare Setting
Amy Roan Moy, OD, FAAO, CPCO, FNAP, Crystal Lewandowski, OD, FAAO, FNAP
Abstract
Optometric institutions providing clinical care in their facilities and extended clinical networks are held to the same regulatory standards as other healthcare organizations. This article describes the importance of peer chart reviews and quality assurance in the academic optometric setting in relation to providing opportunities for improving quality of care, setting an example for optometric students, and setting clinical standards as an institution in parallel with federal healthcare guidelines.
Key Words: compliance, chart review, audit, quality, assurance, optometry
Introduction
In recent years, patient safety and quality of care have become increasingly important in healthcare as there has been an increased focus on improving clinical outcomes, as well as reducing healthcare disparities across the United States.1 According to the Health Resources and Services Administration (HRSA), quality improvement (QI) is a continuous improvement process focused on processes and systems, whereas quality assurance (QA) measures compliance against certain necessary standards, typically focusing on individuals in clinical practice.2
Healthcare organizations and oversight agencies have prioritized clinical chart reviews (also known as audits) as a tool to assess to improve the delivery of healthcare services and implement quality improvement (QI) initiatives. Several types of chart audits exist, including external audits completed by accreditation bodies and other authorities, and internal audits conducted from within an organization sometimes in preparation for an external audit and commonly organized by a quality committee, supervisor or peer.1,2 Regularly scheduled, formal peer chart reviews help to assure patient safety and quality of care in compliance with federal and state regulations, as well as provide some protection for organizations against litigation. Collection of patient care data during a chart audit process, in combination with reports of adverse events (an incident that results in an undesirable outcome for a patient), can help quantify clinical performance in relation to quality standards and evidence-based research recommendations and help improve professional practice. Peer (clinical) chart review refers to evaluation of chart samples by a colleague, usually to provide feedback with the goal of improvement and maintaining quality of care. This system of quality assurance usually involves two or more providers using a structured method (checklist, survey, or questionnaire) to evaluate another provider’s work. Ideally, this process is part of a long-term and continuous quality improvement program, meant to regularly address potential problems, formulate goals for good care, measure actual care, consider the need for any changes, implement the changes and perform a follow up.3,5
Evidence has shown that chart audits paired with feedback from organizations can be an effective tool to changing individual behaviors in clinical practice. The effectiveness of chart audits paired with feedback is greater when healthcare professionals actively participate in the process, when feedback is given by a person of seniority both with written and verbal feedback, and when feedback is given in repeated cycles as opposed to one single event. Since 1952, the Joint Commission on Accreditation of Hospital Organizations (JCAHO) has required accredited institutions to perform peer reviews to maintain their status.3 Peer chart reviews have gone through many evolutions in the United States, and remain an important tool to measure performance and drive quality improvement initiatives in healthcare.4
Academic institutions can use chart reviews as opportunities to create a gold standard for patient care and preceptor documentation to serve as a model for quality patient care for their student interns. Regular peer chart reviews also offer ongoing education for providers to improve their quality of care. In this optometry school, annual processes have evolved over the years for peer chart review among faculty in clinical practice. This article reviews the methods and trends of the New England College of Optometry’s chart reviews from 2014-2023 and discusses criteria, adjustments made to the process over the years, and the impact on the Clinical Network as a whole. In an effort to understand the impact of the annual peer chart review process on the faculty, a survey was initiated by the Quality Assurance Committee (QAC). As an optometric teaching institution, it is important to model the standard of care and quality assurance for students as they represent optometry among other professions.
In articles as early as 1976, there have been reports of including quality assurance and chart review education in medical schools with the goals to “increase the acceptance of quality assurance activities among student physicians, inculcating in them the importance of peer review at an early stage in professional development.”6 Literature search using the following Medical Subject Headings did not return much literature regarding chart reviews in the profession of optometry: optometry school and quality and assurance, as well as peer and chart review and optometry. In a sole article by JP Ruskiewicz, A DiStefano reviews the quality assurance process at Pennsylvania College of Optometry, now known as Salus University, in 1977.7 Additionally, on the University of California Berkeley School of Optometry and Vision Science website, a bi-annual Quality Assurance process is described;8 five clinic charts are reviewed from a particular period by the QAC chair to assist the Clinic Chiefs and Associate Dean of Clinical Affairs in maintaining quality of exams at their facility. To our knowledge, this is the first peer reviewed publication describing an optometry institution’s quality assurance and annual chart review audit process and process improvements over the course of a decade.
Methods
Chart Review Methods and Process Evolution
Chart reviews can help address the following competencies: medical knowledge, patient care, professionalism, interpersonal communication skills, practice-based learning and improvement and systems-based practice.9 At the New England College of Optometry (NECO), the peer chart review system is two-pronged. For new hires, a chart review is performed by the Quality Assurance Committee (QAC) at least three times in their first year. A copy of the review criteria is provided to them at their orientation. The annual peer review occurs at the same time each year, and participation is mandatory for all clinical providers in the clinical system. Vision screening and resident preceptors are excused from this process.
Members of the QAC are appointed by the Senior Director of Community Health Initiatives and Optometric Compliance with the goal of representation from all sectors and specialties of the Clinical Network. The Clinical Network is defined as the clinical sites either owned by NECO or contracted with NECO for optometric services by the faculty as their clinical assignment. NECO’s Clinical Network is distributed across Massachusetts, mostly centered around the greater Boston area. The disseminated nature of the Clinical Network lends more complexity to how chart samples are obtained, due to multiple electronic health record systems and multiple healthcare facilities.
In the early 2000s, the institution’s chart review criteria was focused on basic requirements, dealing with necessary elements including legibility, completion, updated testing and appropriate treatment plans.
While the basic criteria were important from a compliance perspective, there was a desire from the Quality Assurance Committee to add elements that would influence a move toward more cohesive standards of care and compliance across the clinical network. The current list of review questions can be found in Appendix A (General Chart Criteria) and Appendix B (Low Vision Criteria).
As Medicare’s Physician Quality Reporting System (PQRS) measures were released, the QAC realized that this was a good structural opportunity to re-evaluate the overall criteria for standards of care. Thus began an evolution over the years with the result of a core set of questions to address the following specialties:
- Primary Care/Community Health
- Pediatrics/Vision Therapy
- Contact Lens
- Intellectual and Developmental Disabilities
- Low Vision
In addition, a separate set of questions was modeled after Medicare’s Physician Quality Reporting System (PQRS), which later transitioned to the Merit-based Incentive Payment System (MIPS).10 These questions did not count towards a provider’s score, but informed the committee on overall institutional performance in standards of care. In cases where there were no measures for specialties like Pediatrics or Contact Lens, the committee developed criteria that would also measure standards of care more relevant to their expertise.
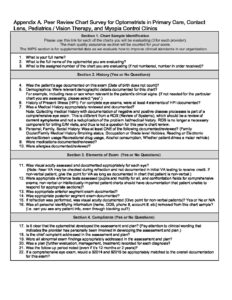
Each provider would be reviewed according to the core set of questions and then depending on the type of chart sample and their specialty, they would branch off into a specific set of clinical standard questions geared towards their specialty. See Appendix A for example of 2023-2024 chart review survey questions for primary care, pediatrics and contact lens charts and Appendix B for low vision survey questions.
The questions for chart review have a few main goals:
- To ensure appropriate tests are being done for comprehensive eye exams and problem-specific exams
- To promote proper documentation as preceptors working with students
- To engage clinical faculty in thinking about clinical standards for the institution
Diagnostic Criteria for Peer Chart Review
Each faculty member with varying clinical foci (primary care, contact lens, pediatrics, low vision, etc.) was asked to submit a certain number of comprehensive eye exams and problem-specific exams each year, with specified diagnostic criteria, which has varied over the years. Historically, each provider self-selected 3 exams with three different, specific diagnoses requested by the QAC. A group of acceptable diagnoses/International Classification of Diseases Codes (ICD) were provided to all faculty members participating in the chart review, and one exam from each diagnostic category was requested (see Appendix C for an example list of acceptable diagnoses). The basis for the primary care group was formed by the main ocular disease categories in the MIPS measures relevant to eye care providers.
- Primary Care/Community Health
- Diabetic Retinopathy
- Glaucoma/Glaucoma Suspect
- Age-Related Macular Degeneration (this was later discontinued due to lack of significant number of AMD patients in most of our clinics)
- A medical exam chart coded 99213
- Pediatrics/Vision Therapy
- Convergence Insufficiency, Convergence Excess, or Accommodative Insufficiency
- Amblyopia
- A medical exam chart coded 99213
- Contact Lens
- Dry Eye, Punctate Keratitis, or Keratoconjunctivitis sicca
- Regular Astigmatism
- A medical exam chart coded 99213
- Intellectual Disabilities
- Decided on a case-by-case basis, depending on whether the provider works with mostly adults or pediatric patients
- Low Vision
- A consultation visit with diagnosis of Age-related macular degeneration
- A consultation visit with diagnosis of Diabetic Retinopathy
- A medical exam chart coded 99213
The general timeline goes as follows for the peer chart review cycle:
- September: QAC reviews criteria and decides on chart sample requirements
- October: Chair of QAC sends out request for required randomly self-selected chart samples from each provider and begins assigning 2 peer providers to review each provider, generally within their own specialty.
- November: Chart samples are reviewed for quality by QAC, ensured for de-identification of Protected Health Information (PHI), and sent securely and electronically to assigned providers. Criteria are found on Survey Monkey, where peer reviewers (not a blind review) enter the scores for each chart sample.
- December: All raw data for scores are analyzed and summarized.
- January: Individual score letters with “pass” or “not pass” designation and reviewer feedback/comments are sent to all faculty who participated in the process. Findings are also presented to faculty and Board of Trustees and sent to contracted health center partners.
The quality of samples is key to a successful chart review process without delays. The onus is put on providers that in submitting these samples, they are agreeing to be scored as-is. Points are taken off for not fully de-identifying PHI. Over the years, providers have been asked to select their chart samples themselves due to the complexity of the geographically distributed clinical network. There is potential for bias in providers selecting their own samples, and this will be discussed later in the article. Moving from paper chart samples to digitized chart samples in a secure drive made the process much smoother and more efficient in order to coordinate the samples of 40 providers in geographically different locations.
Other adjustments to the process over the years have included a growing Quality Assurance Committee, with representation of various specialties throughout our institution. There have also been adjustments to survey questions and eligible diagnoses acceptable for chart review over the years, to reflect most frequently encountered diseases in our clinics. Also, there has been an increase in the number of charts evaluated from various EHR platforms, which has led to discussions of functionality, limitations and various nuances of different EHRs as they pertain to chart documentation and quality measures.
Merit-Based Incentive Payment System (MIPS) Measures
The institution regularly monitors adjustments to the MIPS measures as issued by the Centers for Medicare Services (CMS).11 These quality measures are a useful tool for assessing standard of care in the clinical network.
The official MIPS standards that have applied to optometrists are listed below:
- Measure 12: Percentage of patients aged 18 years and older with a diagnosis of primary open-angle glaucoma (POAG) who have an optic nerve head evaluation during one or more visits within 12 months
- Measure 14: Age-Related Macular Degeneration (AMD): Dilated Macular Examination
- Measure 18: Diabetic Retinopathy: Documentation of Presence or Absence of Macular Edema and Level of Severity of Retinopathy
- Measure 19: Diabetic Retinopathy: Communication with the Physician Managing Ongoing Diabetes Care
- Measure 117: Dilated Eye Exam for patients 18-75 years old with diabetes in the past year
- Measure 130: Documentation of Current Medications in the Medical Record
- Measure 140: Age-Related Macular Degeneration (AMD): Counseling on Antioxidant Supplement
- Measure 141: Primary Open-Angle Glaucoma (POAG): Reduction of Intraocular Pressure (IOP) by 15 percent OR Documentation of a Plan of Care
Please note: As of 2023, Measures 117 and 130 have been removed from claims-based reporting
Other measure that may apply are as follows:
1: Diabetes: Hemoglobin A1c (HbA1c) Poor Control (>9%)
226: Preventive Care and Screening: Tobacco Use: Screening and Cessation Intervention
236: Controlling High Blood Pressure
238: Use of High-Risk Medications in Older Adults
317: Preventive Care and Screening: Screening for High Blood Pressure and Follow-Up Documented
318: Falls: Screening for Future Fall Risk
374: Closing the Referral Loop: Receipt of Specialist Report
In addition to the criteria for required documentation elements, all comprehensive eye exams have specific standard of care questions applied to them from the list above, to be adjusted by the Quality Assurance Committee depending on prioritized initiatives for that year. Primary Care providers will use official MIPS measures, while the specialties have other standard of care questions specific to their modalities. Low Vision practitioners have a separate set of criteria in a different survey, tailored to their specialized exam elements. Figure 1 shows an example of a condition-specific MIPS question geared towards a chart sample for the diagnosis of glaucoma or glaucoma suspect.
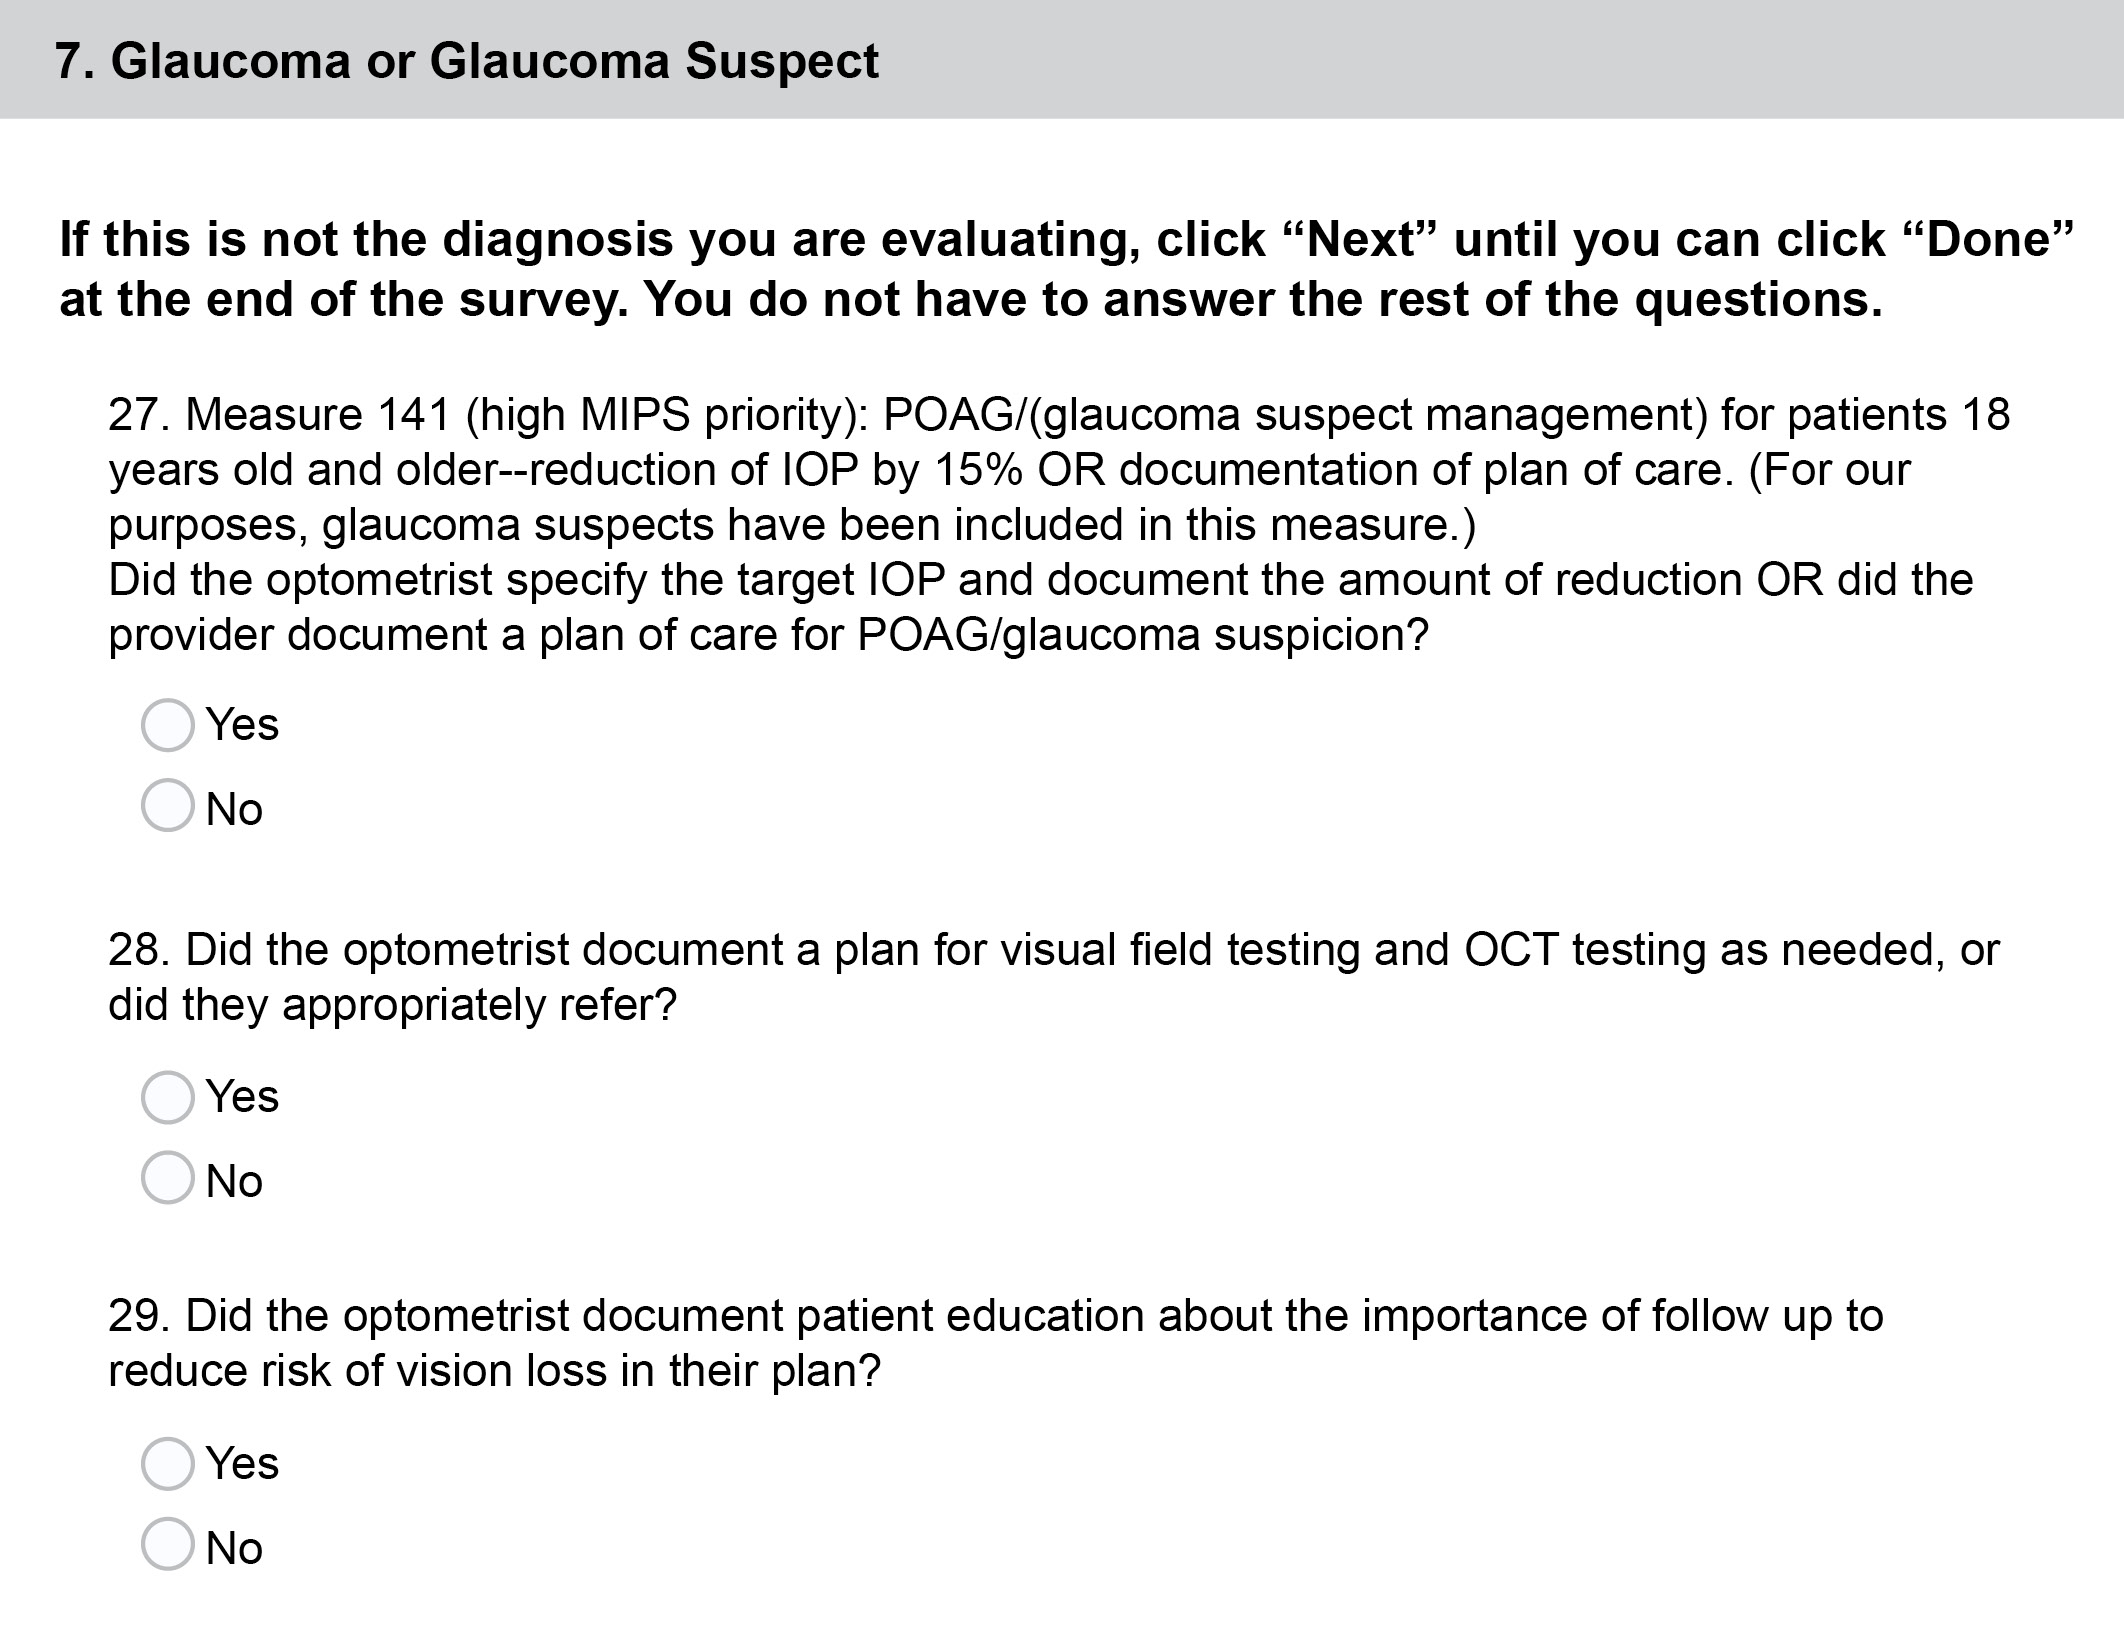
Figure 1. An example of standard of care questions for Primary Care optometry faculty. Click to enlarge
A summary of the institution’s collective performance is reported to the faculty and Board of Trustees each year. Plans are developed and implemented to improve these scores each year as part of our quality improvement process.
Results of Chart Review Process
Over time, the pass rate has trended upwards towards 100% pass rate for all faculty (Figure 2). An average score of 85% or higher was deemed a “pass.” The total average score for all charts reviewed in 2022-2023 was 97.8%. Specialties were broken down into categories and provided their own specialties’ score ranges and standard deviations. For example, the breakdown of scores by specialty for the year 2022-2023.
- Primary Care average score: 97.3% with 0.05 std dev
- Pediatrics/Vision Therapy average score: 99.3% with 0.03 std dev
- Low Vision average score: 2% with 0.05 std dev
- Contact lens average score: 97.4%% with a 0.04 std dev
The scores are then set individually and to each faculty member, along with secure links to their chart samples. With a consistently high pass rate in the last 5 years, the QAC implemented a faculty survey to better understand the impact of the chart review process on faculty.
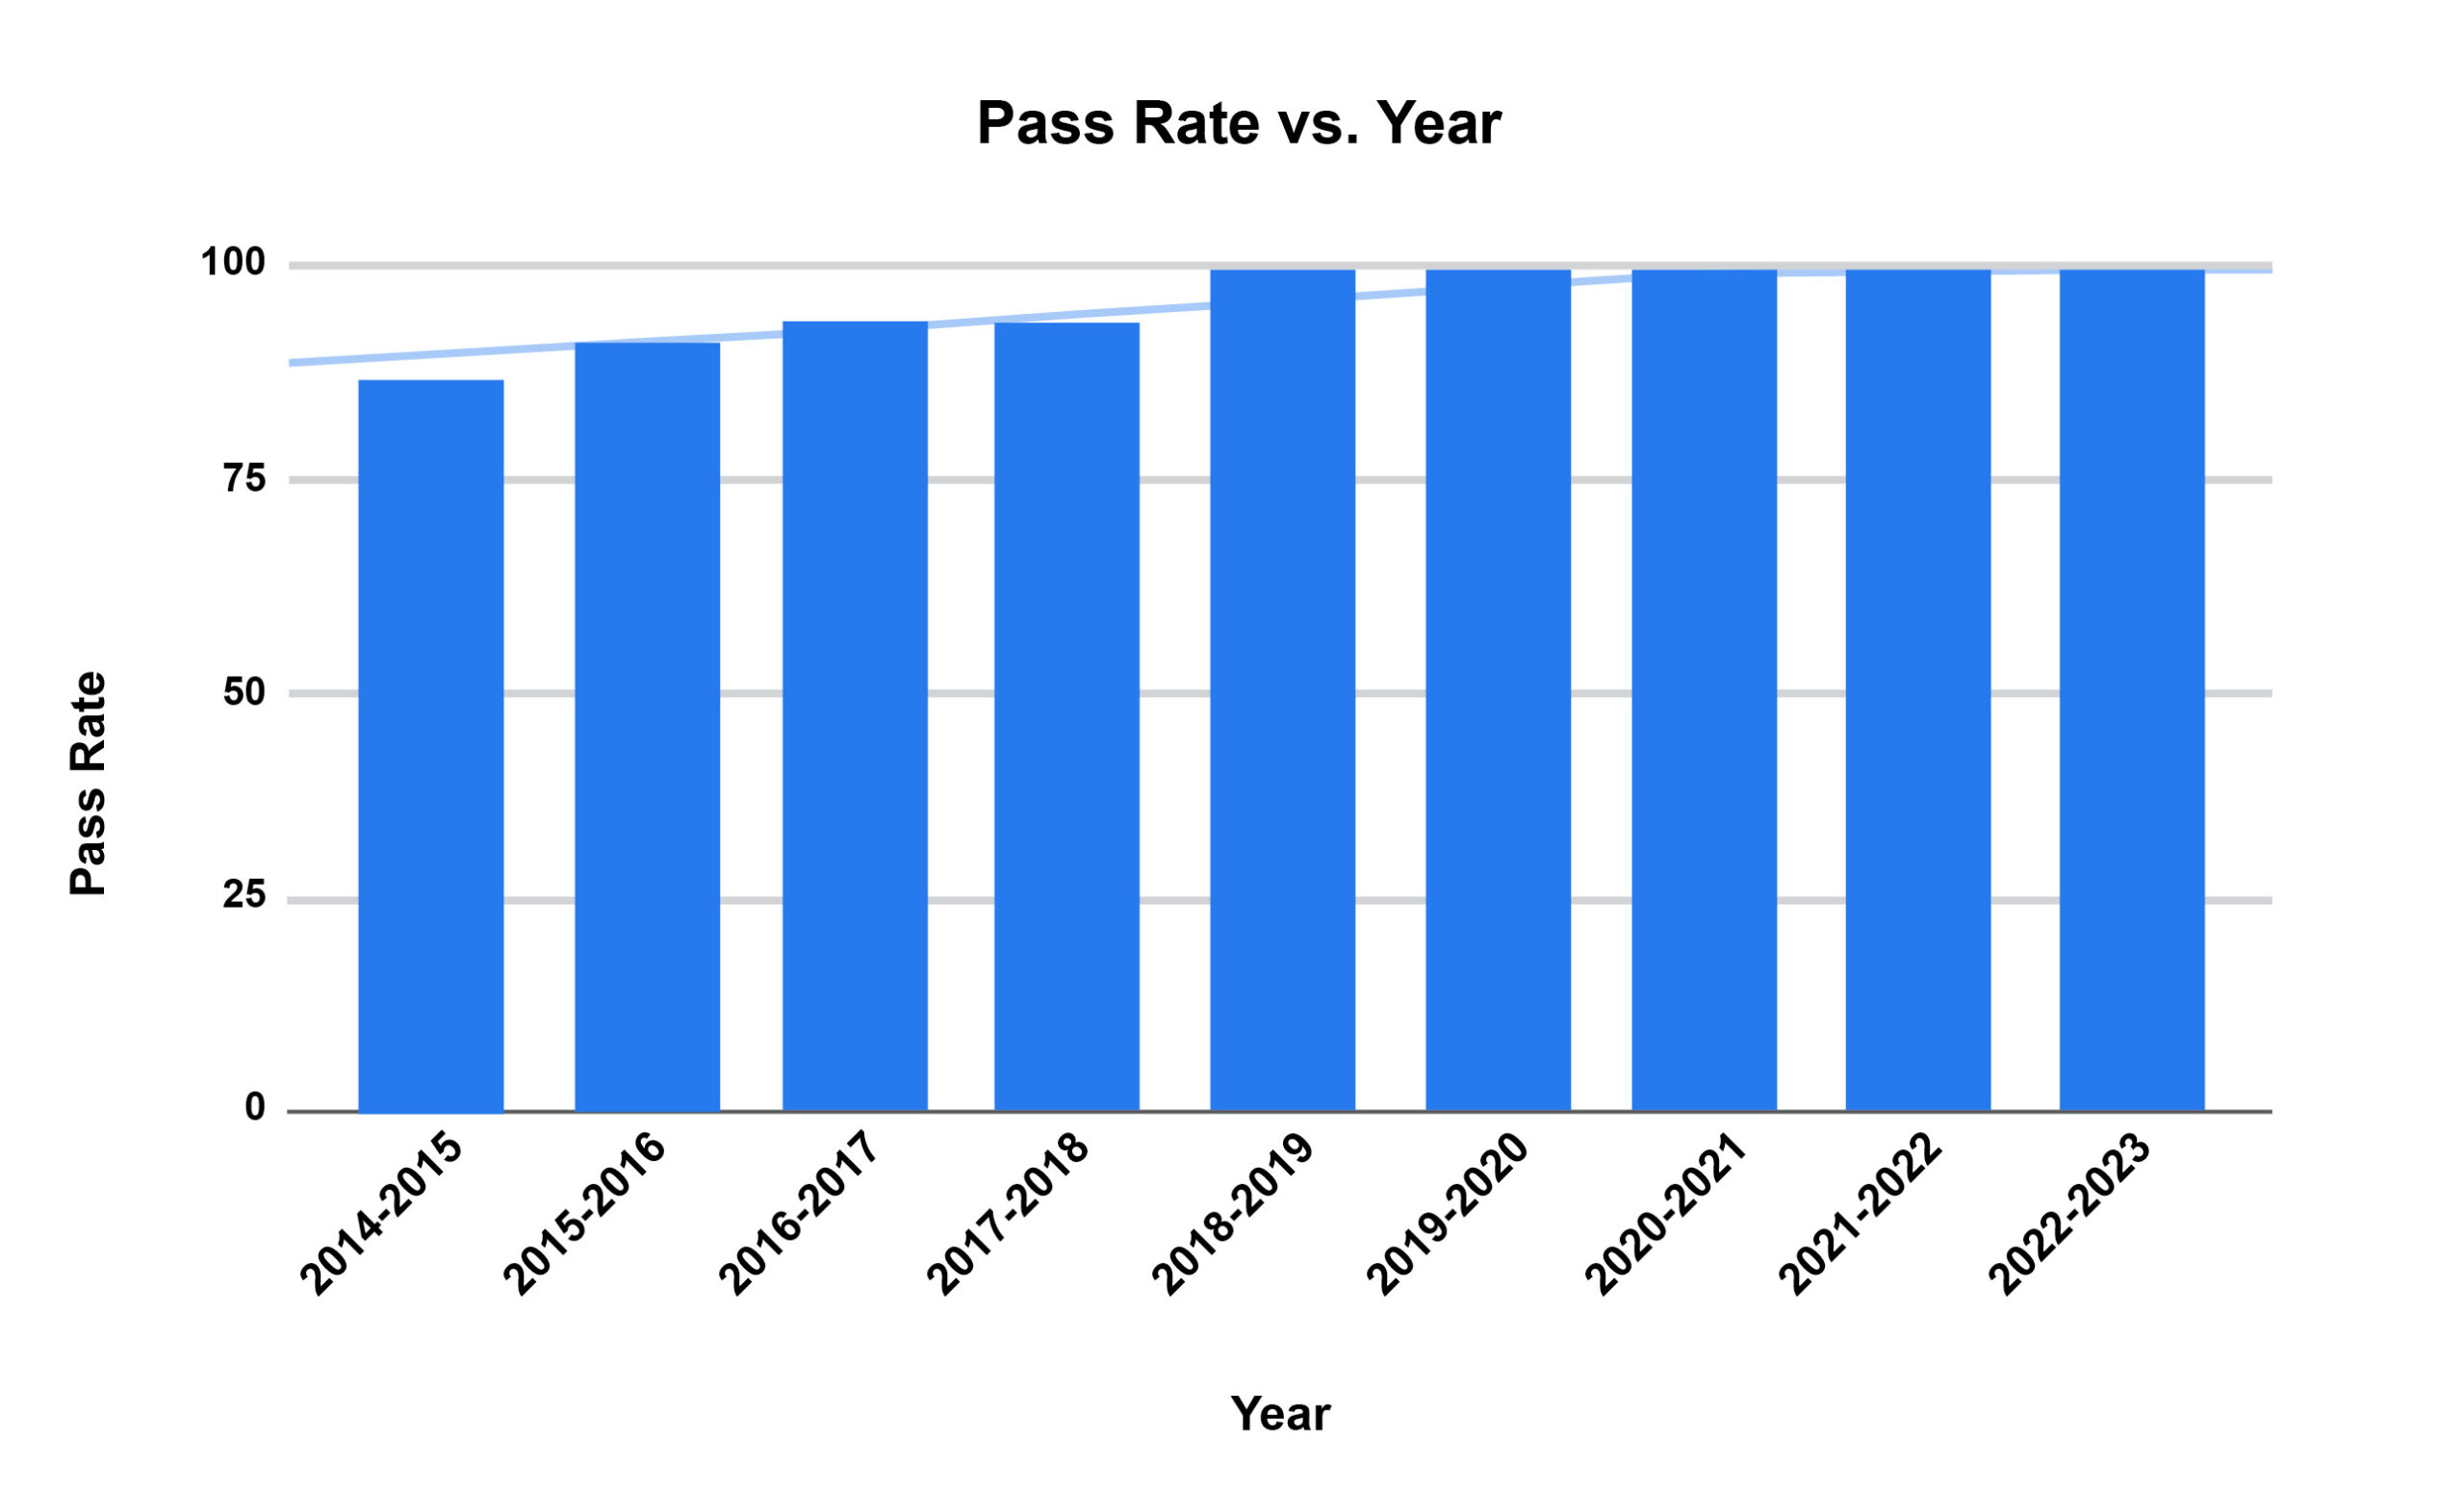
Figure 2. Peer Review Pass Rate Trending Over Time Click to enlarge
Faculty Survey of Chart Review Process
The impact on the Clinical Network has been measured by an upward trend of improvement in pass rate. In addition, anecdotally there have been fewer student comments regarding wide differences in documentation behavior by preceptors. As the average pass rate consistently settles at 100% over the last few years, we continue to look for ways to measure, maintain and improve standard of care across our sites. A survey was conducted to measure the impact of the annual peer chart review process on various aspects of faculty behaviors, decision-making and compliance.
Feedback on the peer clinical chart review process was solicited in 2022-2023 to assist the QAC with next steps, since the pass rate has consistently been high in the past few years. A 13-question survey was developed to ask the clinical faculty for their feedback.
Faculty Survey Methods
Survey Monkey was used to build validated core questions and then tailored to the purposes of the survey. A link to the survey was sent out to all clinical faculty in the Clinical Network. Responses were anonymous.
Faculty Survey Results
31 out of 34 clinical faculty responded. 38.7% were based in the main clinics, while 51.6% were based in the community health center network. 3.2% saw patients in the Outreach clinics, and 6.5% were from other parts of the Clinical Network. The level of experience in practice was essentially evenly distributed in the faculty sample. Figure 3 shows the number of years the faculty had practiced optometry, showing a generally even distribution.
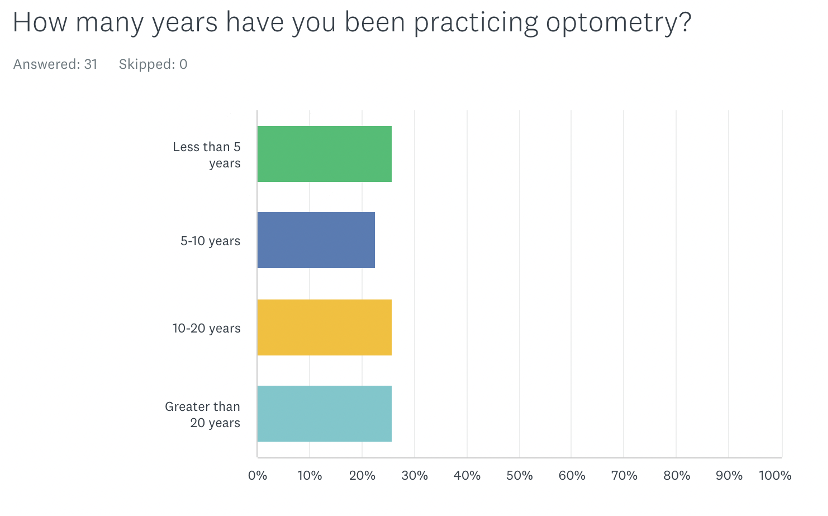
Figure 3. Number of years in clinical practice reported by faculty. Click to enlarge
A survey goal was to measure the impact of the peer review process on the faculty members. 80.8% responded that the process impacted their own chart documentation, and there was additional impact on teaching of interns about chart documentation, understanding of billing with respect to charting and quality of care (see Figure 4).

Figure 4. Impact of peer review chart process. Click to enlarge
77.3% of respondents also answered that using digitized chart samples via a secure Google Drive link was Very Easy or Easy compared to paper chart samples.
Discussion
When Standard of Care is in Question
Faculty members who score 85% or lower meet with the Chief Compliance Officer and a Performance Improvement Plan is developed. A subsequent chart review is done several months later and reviewed by members of the Quality Assurance Committee. Department chairs are notified of the plan as well. Upon second review after generally a 3-month remediation period, 100% of those on a performance improvement plan have passed the review.
Lessons Learned
Differences in Electronic Health Records made for some reviewer error when looking at peer chart samples from an EHR system with which they were unfamiliar. A common complaint was that a reviewer had missed an element such as medications and allergies being documented, because it was elsewhere than expected. While several EHR systems are used within our diverse core clinical network of 13 sites, we were unable to assign providers solely based on their familiarity with the EHR systems due to logistics and numbers of providers.
A question was added on implicit provider bias to determine whether there was a perception that their reviewer might have implicit bias affecting the scoring of the samples (Figure 5). In general, most faculty felt that implicit bias of the reviewer was not a significant factor in their score.
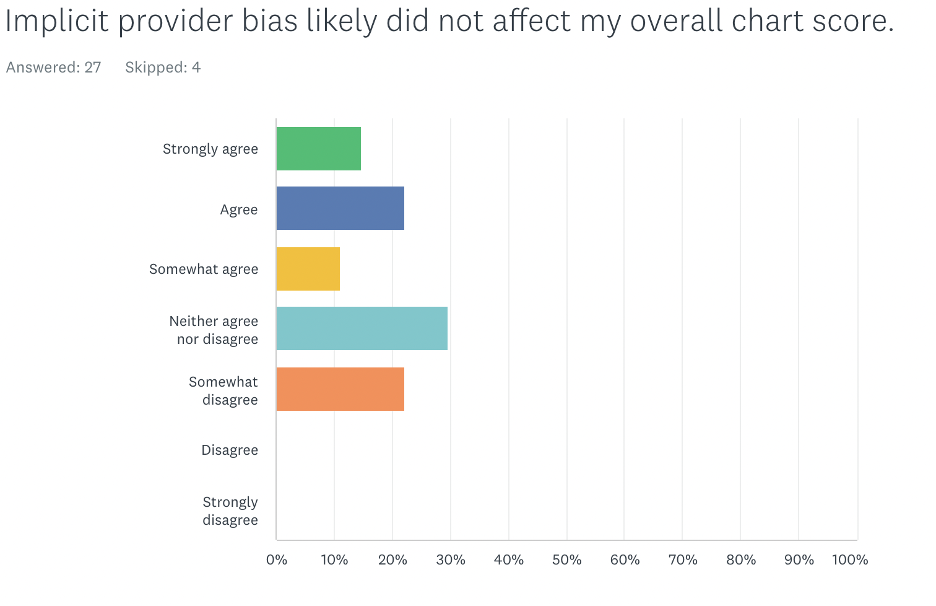
Figure 5. Faculty perception on whether reviewer bias impacted their overall chart score. Click to enlarge
Randomizing chart samples has been a historic struggle for the Clinical Network due to the distributed nature of our clinical sites. As the trend of persistent 100% pass rates has occurred over the past few years, the committee pivoted to pursuing randomized chart samples, relying on clinic directors at each site (and a chosen colleague for themselves) to assign a colleague to randomly select chart samples for their assigned peers. Those who were sole providers at a few sites still provided their own samples for logistical purposes. It was anticipated that the passing rate would decrease with this new system, but interestingly, the pass rate was still 100%, albeit with no significant difference in scoring among each primary care and specialty category.
In the faculty survey, about 27.6% of optometrists noted that the survey was “not so relevant” to their role as an OD. We presume some explanations for these responses could be due to the following potential reasons: some providers do not see Medicare patients (i.e. Pediatric specialists), they may not be aware of the relationship between MIPS and Medicare payments and incentives, and some may be ignorant of specific MIPS requirements and reporting implications.
Influence on Optometric Education
The impact of the peer chart review process on teaching interns about chart documentation needs further investigation. Heiman and Raminsky et al reported surveying 163 third-year medical students at one medical school about their observations, practices and attitudes regarding electronic documentation efficiency tools. 86% of respondents reported at least sometimes observing residents copying data from other providers’ notes, and 60% reported observing their attendings doing so. Only 10% stated that copying from other providers was acceptable.6 The need for completeness of chart documentation has elicited various workarounds and methods for efficiency such as copying and pasting or auto-insertion of data. When asked if the chart review was relevant to how optometrists review student charting, faculty were widely spread on their responses. 59.3% of respondents agreed that the process had some impact on how they review student chart documentation (Figure 6). This was the first time that the faculty had been asked this question.
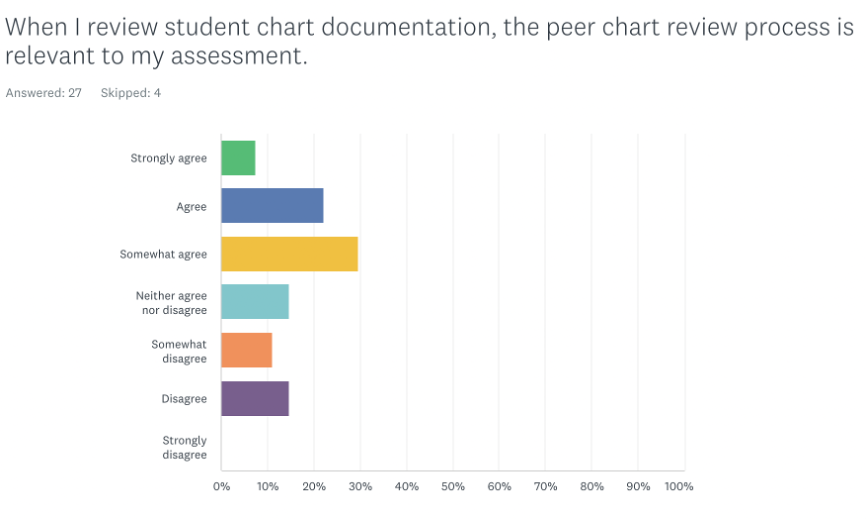
Figure 6. Faculty response to whether the peer review process is relevant when reviewing student documentation. Click to enlarge
Chart review and simulated chart reviews can be used as a starting point for clinical preceptors to assess students’ clinical reasoning skills and clinical documentation. When attendings document in their charts and notice details relevant to quality measures have not been documented by students, it provides a teaching opportunity to discuss clinical decisions and thought processes, best practices, EHR usage as it pertains to compliance and audits in optometric practice, billing and coding with various insurance plans and vision discount plans, practice management and business revenue, and public health outcomes and health care quality.7
Routine chart review also provides an opportunity for attendings to give interns prompt, meaningful feedback, which can serve as a positive, motivational form of interaction between the preceptor and intern. This learning tool can help students improve their clinical reasoning, be a hands-on teaching strategy to teach the impact of documentation and help hold students accountable in clinic and can provide a communication model for students on how to give feedback in the future. If conducted by peers or in a group setting, a culture of teamwork and collaborative learning may occur. Ultimately, healthcare students may benefit from clinical chart audit simulations in helping them prepare for realistic practice where they will be held to regulatory standards; students can reflect on their documentation skills, identify areas where they may need improvement, and learn from their mistakes in a safe and supportive learning environment.
Potential preceptor questions in the clinical setting for students about their documentation are as follows:
- What is a more clinical term or description for the wording you used here? (Ex. Instead of gray deposit, write “gray flat lesion, 1 mm wide and 2 mm long, 1 DD superior temporal to macula”)
- It looks like you recorded that the patient was having flashes lately, but no other information is written about it. What other information do we need to document to show that these were flashes from pressing on their eye?
- What are relevant pertinent negatives that should be documented in your slit lamp and dilated fundus exam for the systemic conditions that your patient has?
- I see that your assessment and plan is comprehensive, but would you check to see if your chief complaint matches your assessment and plan?
- If the patient’s vision was reduced, was there a diagnosis with reasoning for reduced vision documented or a plan to investigate the cause for reduced vision further?
- Let’s talk about follow up intervals for each of your plan elements. Some of them are missing.
- What other healthcare professionals might you consider communicating exam findings to (and document that you did so) after a patient’s visit, and under what circumstances might you do so?
Future initiatives will also investigate how to incorporate student learning about chart documentation into the curriculum or their clinical rotation experience. Some studies suggest that involving medical students in chart audit processes may help improve student understanding about the importance of chart documentation and clinical practice guidelines and can also have a significant impact on improving quality indicators for care delivered in practice.1
Involvement of students in the chart auditing process is the next step in embedding clear documentation principles and practices across all sites. Some strategies may include: introducing chart audits in first year before entering rotations, requiring chart auditing exercises in second-year as students matriculate into clinical rotations, or conducting a mock audit in third-year as students have more frequent and in-depth clinical assignments. Embedding chart review in a clinical reasoning seminar may also invite opportunities for small group discussions.
Optometric institutions must educate the next generation of optometrists to understand the importance of charting compliance, standard of care and continuous quality assurance and quality improvement processes. In doing this, we protect our patients, ourselves and our institutions.
Conclusion
There may be many reasons for academic and healthcare organizations to conduct regular chart audits: to evaluate performance measures and Healthcare Effectiveness Data and Information Set (HEDIS) requirements, to be in compliance with federal regulations requiring that health care documentation justifies billing and coding, for clinical or operational research, or to measure and compare quality of care among organizations. Through internal chart review and audit processes, at-risk areas and systemic challenges can be identified and then addressed to improve quality of patient care. Compliance information can be disseminated on a wide-reaching scale while facilitating discussions about standard of care, quality of care and healthcare outcomes, and optometric education in a clinical setting. Internal chart reviews processes are an important undertaking that can help support organizations in achieving healthcare objectives and when involving students and residents, can aid in educating the next generation of clinicians.
Acknowledgements
The authors would like to thank Dr. Aurora Denial for her valuable guidance, as well as our Quality Assurance committee members over the years.
References
- Hut-Mossel L, Ahaus K, Welker G, Gans R. Understanding how and why audits work in improving the quality of hospital care: A systematic realist review. PLoS One. 2021;16(3):e0248677. Published 2021 Mar 31. doi:10.1371/journal.pone.0248677
- Office of Justice Programs. [cited 2024 May 7]. Available from: https://www.ovcttac.gov/saneguide/maintaining-a-quality-program/quality-assurance-and-quality-improvement/#:~:text=According%20to%20the%20Health%20Resources,focused%20on%20processes%20and%20systems.
- Vyas D, Hozain AE. Clinical peer review in the United States: history, legal development and subsequent abuse. World J Gastroenterol. 2014 Jun 7;20(21):6357–63. doi: 10.3748/wjg.v20.i21.6357
- Edwards MT. In pursuit of quality and safety: an 8-year study of clinical peer review best practices in US hospitals. Int J Qual Health Care. 2018 Oct 1;30(8):602–7. doi: 10.1093/intqhc/mzy069
- Grol R. Quality improvement by peer review in primary care: a practical guide. Qual Health Care. 1994 Sep;3(3):147–52. doi: 10.1136/qshc.3.3.147
- Heiman HL, et al. Medical Students’ Observations, Practices, and Attitudes Regarding Electronic Health Record Documentation. Teaching & Learning in Medicine, [s. l.], v. 26, n. 1, p. 49–55, 2014. Accessed: 24 May 2024. doi: 10.1080/10401334.2013.857337
- Barr DM, Wollstadt LJ, Goodrich LL, Pittman JG, Booher CE, Evans RL. The Rockford School of Medicine undergraduate quality assurance program. Journal of Medical Education 51(5):p 370-7, May 1976. doi: 10.1097/00001888-197605000-00003
- Ruskiewicz JP, DiStefano A. An optometry course on quality assurance. Am J Optom Physiol Opt. 1977 Dec;54(12):852–5. doi: 10.1097/00006324-197712000-00009
- University of California–Berkeley, Optometry. Clinic Policies and Procedures. [cited 2023 Sep 12]. Quality Assurance. Available from: https://optometry.berkeley.edu/clinicmanual/clinic-policies-and-procedures/quality-assurance
- Philibert I. Using Chart Review and Chart-Stimulated Recall for Resident Assessment. J Grad Med Educ. 2018 Feb;10(1):95–6. doi: 10.4300/JGME-D-17-01010.
- American Optometric Association. American Optometric Association. 2023 [cited 2023 Sep 12]. 2023 AOA MIPS Guidebook Road Map for Doctors. Available from: https://www.aoa.org/AOA/Documents/AOA%20More/AOA_2023%20MIPS%20Guidebook_Road%20Map%20for%20Doctors%20-%20final.pdf
- Centers for Medicaid and Medicare Services. Explore Measures and Activities. 2022 [cited 2023 Oct 26]. Quality Payment Program. Available from: https://qpp.cms.gov/mips/explore-measures
- Gould BE, Grey MR, Huntington CG, et al. Improving Patient Care Outcomes by Teaching Quality Improvement to Medical Students in Community-based Practices. Acad Med 77(10):p 1011-1018, October 2002. doi: 10.1097/00001888-200210000-00014
Appendices
Appendix A. Case description for Case #1. Click to enlarge
Appendix B. Survey questions and answers. Click to view
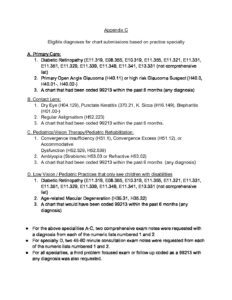
Appendix C. Eligible diagnoses for chart submissions based on practice specialty. Click to enlarge