PEER REVIEWED
The Use of OCT in Differential Diagnosis of Elevated Optic Discs
Elizabeth Wong, BOptom (Hons), MOptom, GradCertOcTher, Jaclyn Chiang, BOptom, MOptom, GradCertOcTher, Michael Hennessy, BMedSc, MBBS, MBiomedE, FRANZCO, Michael Kalloniatis, BSc (Optom), MSc (Optom), PhD, GradCertOcTher, and Barbara Zangerl, DVM, PhD
Abstract
Optical coherence tomography (OCT) can aid in the differential diagnosis of optic nerve head (ONH) elevation. Specific OCT hallmarks, such as “V contour” and a “lumpy-bumpy” appearance, associated with optic disc edema and optic nerve head drusen, respectively, were investigated in isolation from line scans added to photographs of various elevated ONHs in a web-based survey distributed among Australian and New Zealand optometrists. Despite randomization of participants into a control (n=91) and intervention group (n=106), who were offered a short education on the investigated OCT feature, diagnostic accuracy was solely correlated with self-reported experience with OCT scans. As such, the provision of educational material did not result in anticipated improvement of clinical acumen for differentiation of elevated pathological optic discs from elevated non-pathological optic discs.
Key Words: optic nerve head, papilledema, elevated optic disc, differential diagnosis, optical coherence tomography
Background
One of the challenges facing the ophthalmic care provider in clinical practice is the presentation of an elevated optic nerve head (ONH). The most critical initial assessment aims to differentiate true papilledema from pseudopapilledema due to the fundamentally different implication regarding appropriate care.1 Papilledema, one of the most common reasons for optic disc edema (ODE), is triggered by raised intracranial pressure and requires urgent management to circumvent a potentially fatal outcome. Pseudopapilledema, on the other hand, comprises a variety of conditions that can be managed through routine reviews, most commonly buried optic nerve head drusen (ONHD), obliquely inserted optic discs or crowded optic discs.2,3
The increasing use of optical coherence tomography (OCT) in primary ophthalmic practice has allowed the in-vivo visualization of the retinal layers, thereby improving patient management in optic nerve and retinal disorders. Given the time and cost involved in obtaining OCT scans, it is vital for practitioners to gauge the overall significance of it as a diagnostic tool and evaluate OCT features that are better suited to add to diagnostic accuracy. It is commonly acknowledged that education can improve the application of individual techniques. Therefore, the interpretation of OCT may well depend on the familiarity of the practitioner with the method.3-7
Recent studies have suggested that OCT can improve differential diagnosis between true swelling and pseudopapilledema.2, 8-10 The retinal nerve fiber layer (RNFL) has been extensively studied as an important contributor to ONH disease, 2, 11-17 and thinning or thickening can be present in both ODE or ONHD depending on the stage of the disease.16,18 A recent study by Johnson et al8 describes specific features on OCT that can provide guidance to practitioners for differentiation of ODE and ONHD. The study also suggests that RNFL thickness values may assist in the differentiation between ODE and ONHD, but the authors identify unique image features that are associated with these two ONH changes. ODE is characterized by the formation of a “lazy V contour” created by a subretinal hyporeflective space adjacent to the ONH. ONHD presents with a “lumpy-bumpy” internal contour of the optic nerve.8 The “lazy V contour” and the “lumpy-bumpy” appearance proposed to be diagnostic for ODE and ONHD, respectively, may be difficult to distinguish from each other and from tilted or crowded optic discs.1 Consequently, it was of interest to evaluate these particular features as diagnostic markers and consider integration into future recommendations regarding OCT image interpretation. Aside from the differentiation of pathological optic discs from non-pathological optic discs, we were also interested in differentiating obliquely inserted and crowded optic discs from each other.19-23 Unlike papilledema and ONHD, crowded optic discs and tilted, obliquely inserted optic discs generally do not require treatment. This differentiation is clinically important to avoid both potential false positive and false negative diagnoses.
To our knowledge, there have been no studies assessing the diagnostic accuracy of OCT hallmarks in the differentiation of pathological optic discs from non-pathological optic discs or examining the impact of educational material on clinical acumen. The current study, therefore, investigated en-face OCT scans using a previously established, individual OCT observation, and aimed to establish its value as a diagnostic parameter in isolation. A web-based clinical study was designed to test the hypothesis that this particular feature enhances differential diagnosis of ONH pathologies if highlighted in the form of respective educational material. Isolated 2D imaging and line scan presentation of individual eyes were chosen to ensure standardized conditions for all study participants and enable evaluation of the investigated feature in the absence of other diagnostic markers, such as RNFL thickness. Although this presentation does not reflect clinical settings, it allows assessment of specific OCT hallmarks to optimize this tool for differential diagnosis of ONH elevation and examines the impact of isolated information on the clinical diagnosis process.
Methods
Case compilation
We developed a case series of elevated optic discs from 40 patients seen at the Centre for Eye Health (CFEH). CFEH is a specialized referral-only imaging and diagnostic center staffed by highly trained optometrists and consulting ophthalmologists. All clinical data were retrospectively collected from patients previously seen at CFEH who had undergone routine ONH examination. Patients were only included in the study if they were unambiguously diagnosed by two optometrists and a consulting ophthalmologist. Diagnoses of ONHD were based on B-scan ultrasonography and fundus autofluorescence and included cases that were classified as buried ONHD on the basis that diagnosis could not be made from ONH photography. If papilledema was suspected, patients were immediately referred to hospital care for further investigation. Only patients with a diagnosis of idiopathic intracranial hypertension confirmed by the consultant hospital ophthalmologist were included as ODE cases in this study. One pathological disc of incipient vein occlusion was included in the case series. In the classification of non-pathological discs, the discs were categorized as congenitally crowded or obliquely inserted. Crowded discs are a congenital variation: a small optic disc with ill-defined margins and no obvious cupping, likely a consequence of the standard number of ganglion cell and optic nerve axons entering at a small optic disc.20,21 Obliquely inserted optic discs are a congenital condition thought to lie within the ocular colobomata spectrum. In these cases the optic nerve penetrates the eye at an oblique angle causing height differences most commonly between the nasal and temporal rim, with the relative elevation causing the appearance of blurring of the disc margins and suspicion of a swollen optic disc.22 For the purpose of this study, disc elevation leading to indistinct margins was mapped per quadrant for each disc, and disc size was recorded. Discs were classified as crowded if at least two quadrants were elevated with indistinct margins in the context of a small disc measured on the retinal photography software (<2.4mm2).20.21 Obliquely inserted discs were defined if the degree of torsion of the longest disc diameter was beyond 15 degrees.19-23
Written consent was obtained from patients following the tenets of the Declaration of Helsinki and ethics protocols approved by the Human Research Ethics Advisory panel of the University of New South Wales (UNSW) Sydney, Australia.
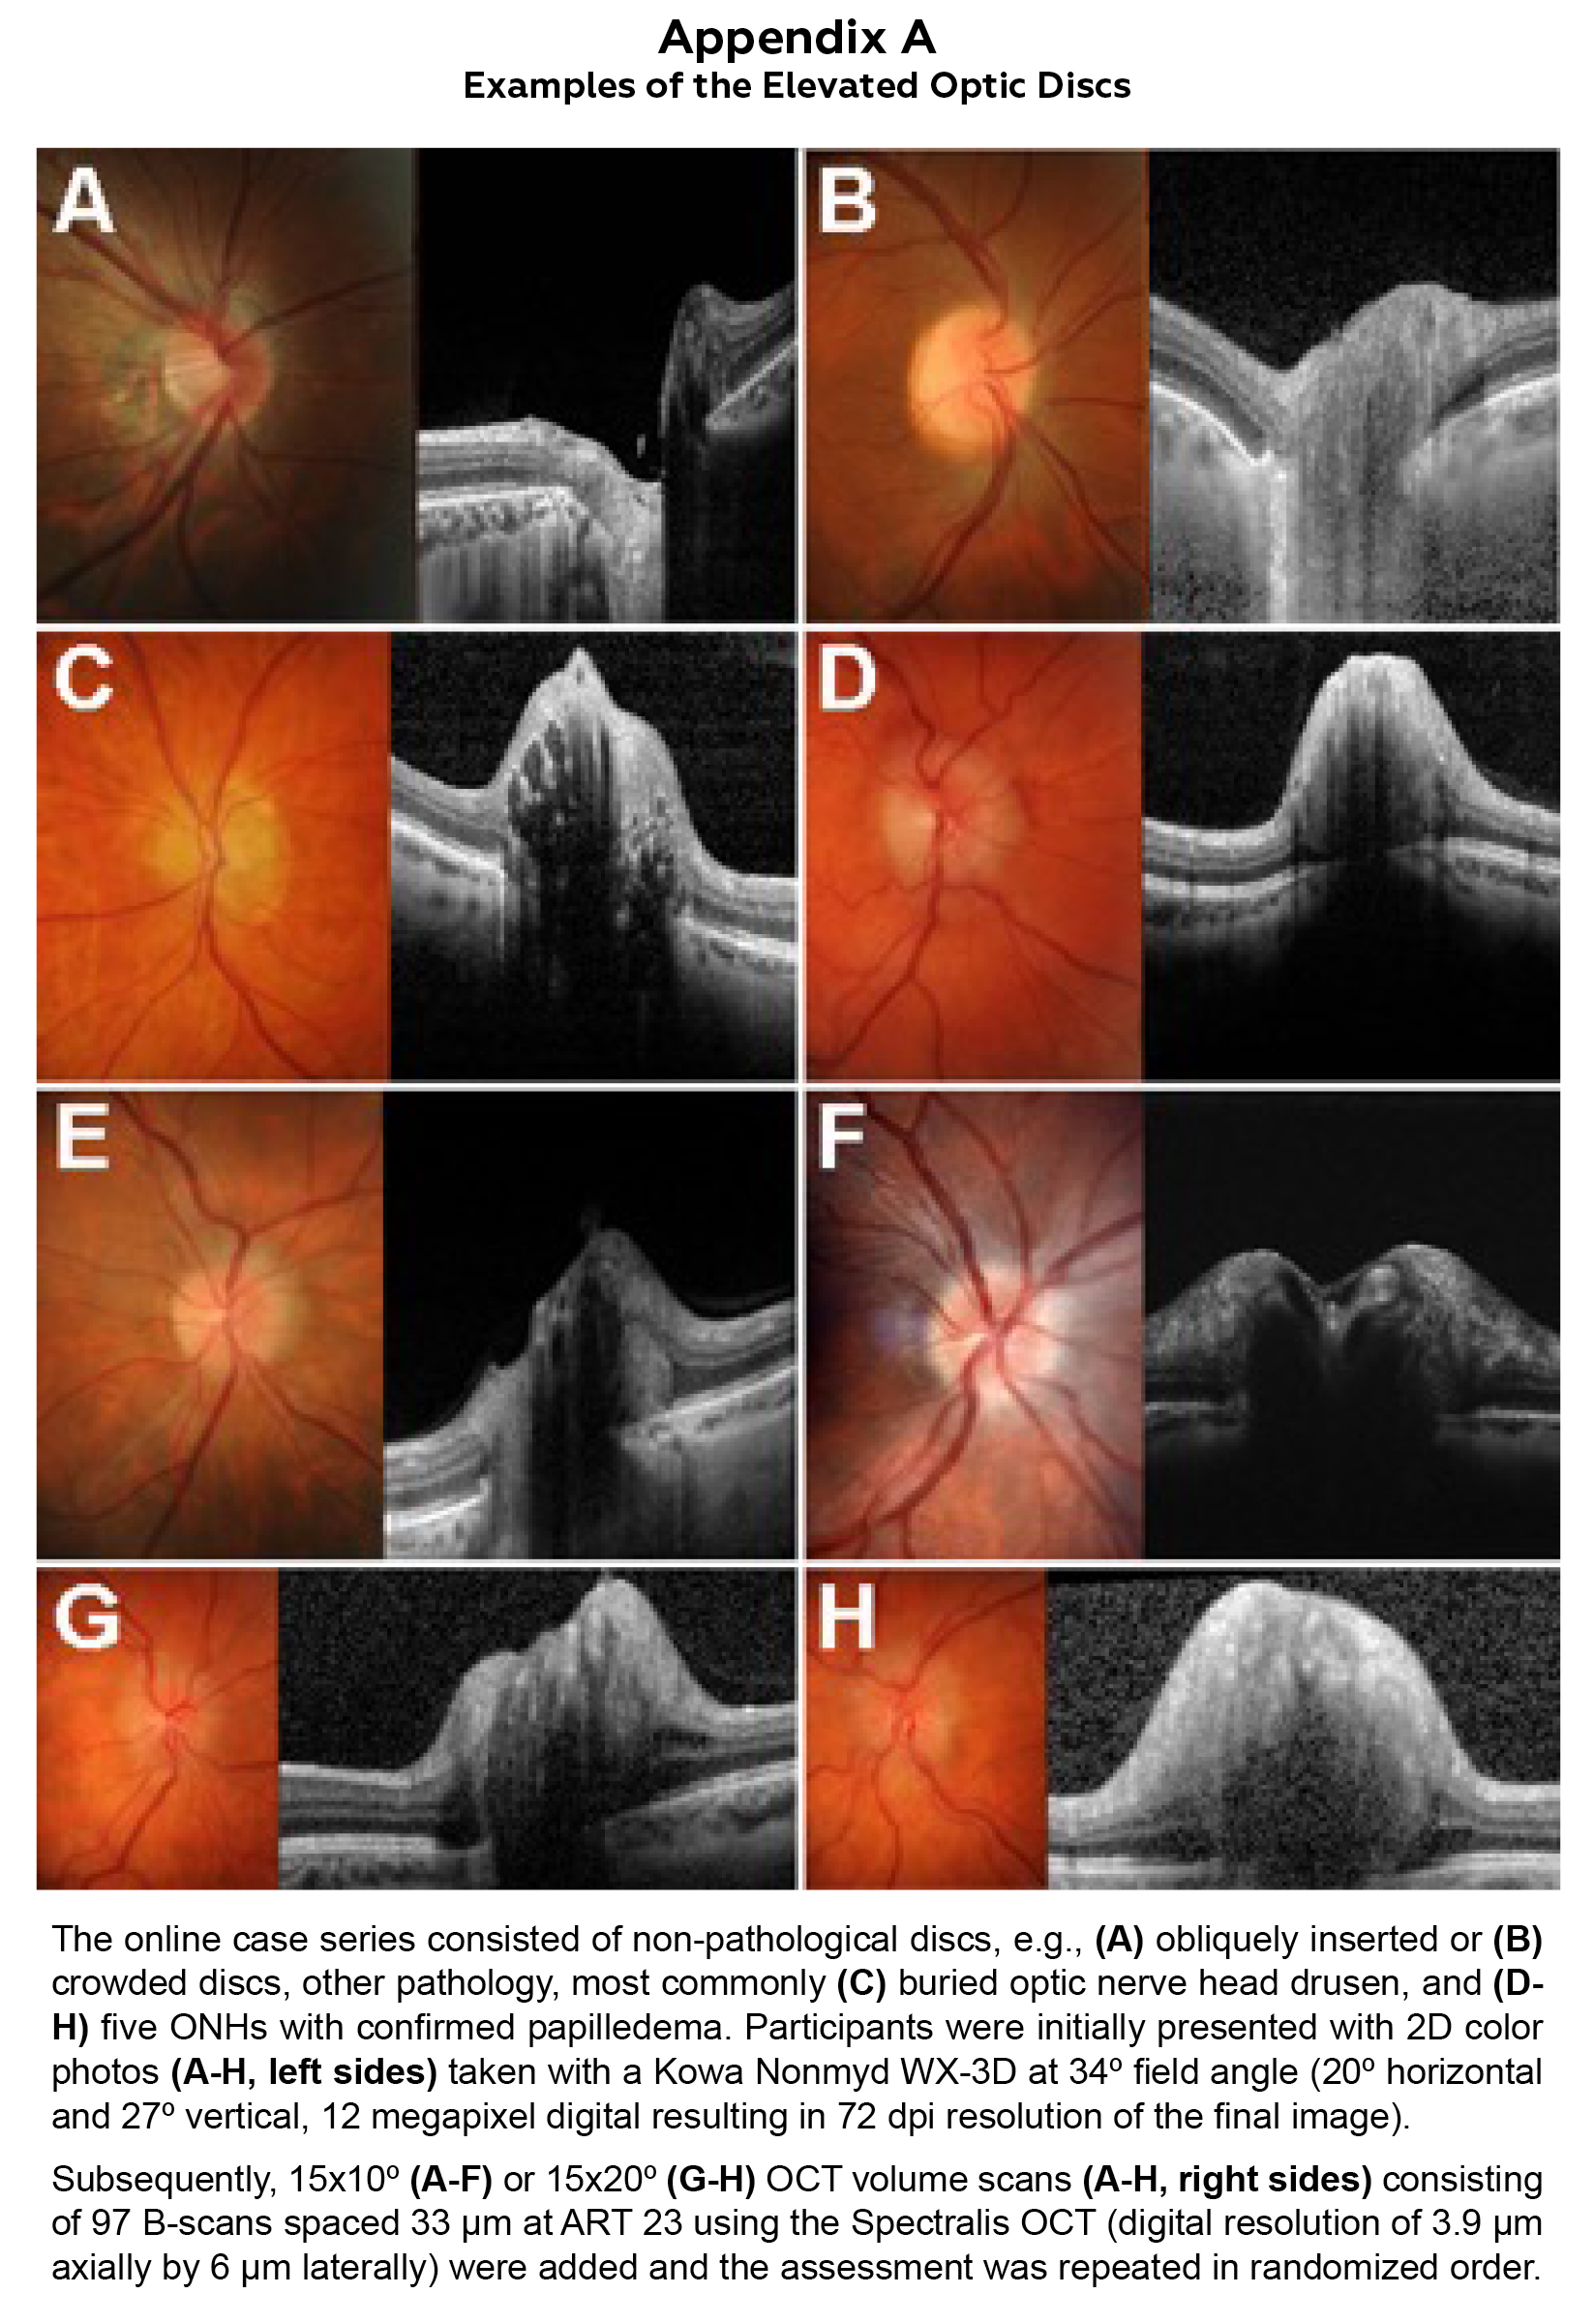
Cases were chosen to reflect the quantity and quality of patients seen in optometry-driven primary eye care, although cases of ODE were limited to papilledema only. As such, the study comprised five papilledematous discs, 18 “normal” discs (8 obliquely inserted, 10 crowded), 16 discs with ONHD and one other pathological disc (incipient vein occlusion). For each patient, a color 2D photo was taken with a Kowa Nonmyd WX-3D at 34º field angle (20º horizontal and 27º vertical, 12 megapixel digital resulting in 72 dpi resolution of the final image). An OCT line scan through the center of the ONH was isolated for each patient from a 15×10º or 15×20º OCT volume scan consisting of 97 B-scans spaced 33 µm at ART 23 using the Spectralis OCT (digital resolution of 3.9 µm axially by 6 µm laterally). This single line scan for each patient was chosen independently by two optometrists to best represent the condition, and decided by a third optometrist if equivocal, to ensure standardized conditions for case reviews. The OCT line scans were chosen based on images identified in the literature as specific to the optic disc condition.8-10, 20-22 Image sizes were adjusted to provide views of the ONH. Examples of clinical information, including all five papilledema cases are provided in Appendix A.

Figure 1. All participants (n=197) were initially asked to assess optic disc photos alone. Participants were then randomized into intervention (n=106) and control (n=91) groups. The intervention group was shown short educational material on OCT characteristics. Both groups then assessed the optic disc with OCT information. Click to enlarge
Survey development
Although the survey was completely anonymous, basic demographic and background information about participants’ therapeutic endorsement (TE), geographic distribution, age, gender, number of OCT scans performed per week, and confidence in interpreting OCT was collected for basic statistical information and to gauge the expertise of participants with OCT. The body of the survey aimed to assess the use of specific parameters of OCT to assist with diagnosis. To isolate these parameters, presentation of patient data was standardized as 2D images and OCT line scans, and variables likely to independently influence diagnosis, such as bilateral data or RNFL thickness, were purposefully eliminated. Based on these criteria, participants were asked to classify ONH images of all 40 patients into one of four categories: papilledema, ONHD, other pathological disc, or normal disc. For normal discs, the subcategories of crowded or oblique optic disc were available (Appendix B). At the end of the initial assessment of all 40 images, participants were randomly allocated into a control or intervention group (Figure 1). The control group immediately proceeded to a second assessment round, while the intervention group was provided with a short education summarizing the main OCT characteristics of true swelling, ONHD, obliquely inserted optic discs and crowded optic discs (Appendix C). The same patients were then assessed again in randomized order, but OCT line scans were provided alongside the original ONH images. Once a diagnosis was submitted, optometrists were not able to access the case again. The completed survey was piloted on 12 optometrists from the CFEH and the School of Optometry and Vision Science UNSW Sydney, Australia, prior to distribution. Minor amendments were made based on feedback regarding comprehension before the case series was deployed online via Survey Monkey (https://www.surveymonkey.com).
Participants and collection of data
Practicing optometrists registered with Optometry Australia (4,073, comprising 94% of Australia’s practitioners) and the New Zealand Association of Optometrists (570, comprising 84% of New Zealand’s practitioners) were invited to participate in the study via an e-mail through the respective associations. The invitation letter provided access to the online case series and contained details regarding confidentiality of information, research purpose and informed consent in accordance with the UNSW Sydney Human Research Ethics Advisory Panel. Anonymous participation was limited to a single entry for each participant as identified by their IP address. The number of participating optometrists needed for this study was calculated to detect statistical significance of 5% improvement with 95% power at a p-value=0.01. Assuming 72.5 mean accuracy and equal standard deviation of 5.74 based on the pilot study, this amounted to at least 91 subjects in either group. The online study only remained open until the required number of responses was obtained.
Statistical analysis
After excluding entries with more than 5% of answers missing, a total of 197 entries were analyzed with 106 and 91 optometrists in the intervention and control groups, respectively. Data analysis was performed using IBM SPSS Statistics (Version 21; SPSS Inc., Chicago, IL, USA). The primary outcomes were the number of correct diagnoses (score out of 40) and diagnostic accuracy. Both variables were normally distributed in either cohort (D’Agostino & Pearson omnibus normality test) and were reported as mean and standard deviation (SD). Comparisons between and within groups were tested with chi-squared goodness of fit and paired t-test, respectively. A generalized estimating equations (GEE) model was applied to assess the effect of the intervention on the change in correctly diagnosed patients with the addition of OCT imaging to account for repeat diagnoses. An independent working correlation matrix structure was chosen for a model defined by a normal distribution and identity link function testing for categorical variable intervention in addition to age category, gender, TE, average number of OCTs performed per week and confidence with OCT interpretation.
Results
Diagnoses of potential ONH swelling from ONH photography without and with the addition of OCT line scans for 40 patients were completed by 197 Australian and New Zealand optometrists. Basic demographic details (age and gender) and parameters potentially influencing outcomes, including status of TE, number of OCT scans performed per week, and self-reported confidence in using OCT were equally distributed between the two cohorts (Table 1). The number of cases correctly diagnosed was normally distributed in both the control and intervention groups based on ONH photography before (p=0.22 and 0.44, respectively) and after the addition of OCT line scans (p=0.22 and 0.53, respectively), but differed significantly between the two diagnostic modes for the control group only (paired samples T-test) (Table 2). This was reflected by a decrease in diagnostic accuracy from 66%±8.9 (26.3 average number of
 Table 1. Click to enlarge |
 Table 2. Click to enlarge |
diagnoses) to 63%±10.6 (25.3) in the control group, and change from 66%±9.4 (26.4) to 67%±7.9 (26.9) in the intervention group amounting to a significant difference between the two groups for the OCT line scan (independent samples T-test) (Table 2).
GEE analysis confirmed the significant change from baseline between the control and intervention group after correcting for age, gender, TE, number of OCTs performed per week or confidence in OCT analysis (1.5; 95% CI 0.4-2.7; p-value=0.006). None of these variables was associated with differences between the two groups or overall diagnostic accuracy based on ONH photography, while overall diagnostic accuracy from line scans was correlated with the participant group (control or intervention) as well as the average number of OCT scans performed per week (p<0.01). The difference in change was caused by curbing a subgroup of optometrists who diagnosed fewer patients correctly after the addition of OCT line scans in the control group compared to no significant change between ONH and ONH & OCT assessments in the intervention group (Figure 2).
The impact of investigated OCT parameters on diagnostic accuracy was of particular interest with regard to individual pathology. For the purpose of analysis, the discs were classified into five papilledema cases, 17 other pathological optic discs, and 18 non-pathological optic discs. While non-pathological optic discs included eight obliquely inserted and 10 crowded discs, other pathologies were in essence limited to ONHD and a single case of incipient vein occlusion. Most strikingly, diagnostic accuracy across all 197 participants decreased 13% with the inclusion of OCT line scans for papilledema (from 69% to 56%), while other pathologies showed a 3% decrease (from 64% to 61%) and non-pathological discs were diagnosed 3% more accurately on average (from 68% to 71%). A closer look at the control and intervention groups exposed that the loss of diagnostic accuracy for papilledema cases was mainly caused by a relatively greater loss in the intervention group, while the control group showed almost identical gain and loss of diagnostic accuracy for this particular group (Figure 3).
 Figure 2. The number of correct answers for individual optometrists ranged between 15 and 34 (A), with a similar distribution for the control and intervention group if diagnosis was made from ONH photography only (y-axis), but the control group performed worse if OCT was included (x-axis) (B, C). The change is illustrated by box-and-whisker plots, whereby the box presents the 25th to 75th percentile with the median marked by the engulfed line and the whiskers outlining the range of the obtained answers. Individual changes depicted in between highlight the higher variability in results for the control group (B) after adding OCT line scans as a diagnostic test. |
 Figure 3. The percentage loss or gain of accurate diagnoses after reviewing OCT line scans compared to the original results from ONH photography alone was recorded overall (top) and for individual disease statuses in relation to those diagnoses that remained unchanged (light grey), regardless of whether these diagnoses were initially correct or incorrect. Of note, while changes were relatively consistent within the control group, a large number of practitioners misclassified papilledema after the addition of OCT scans in the intervention group, who showed otherwise similar gain in diagnostic accuracy to the control group. |
 Table 3. Click to enlarge |
More specifically, of all misdiagnosed papilledema cases, 7.4% were classified as ONHD, 51% as “other pathology,” and 41.6% as normal (of these, 80% crowded and 20% obliquely inserted) based on photo presentation only. Following the introduction of the OCT scans, the unidentified papilledema cases were diagnosed as ONHD in 35.3% of cases, as “other pathology” in 22.7% of cases, and interpreted as normal in 42% of cases (54% crowded and 46% obliquely inserted). In the intervention group, percentages were 35.3% and 40.4% for ONHD, 45.6% and 10.3% for “other pathology” and 44.4% (81% crowded and 19% obliquely inserted) and 49.3% (61% crowded and 39% obliquely inserted) for normal with presentation of photo alone and after addition of the OCT line scan, respectively.
Both the control and intervention groups had only marginally more loss than gain with other pathologies cases. This was also true for non-pathological discs in the control group, while the intervention group had a large gain of diagnostic accuracy with these patients (Table 3).
Discussion
Some OCT parameters, such as RNFL thickness, can yield a sensitivity of 98% distinguishing between diseased and healthy ONH, yet specificity lags behind at 77%.8-10, 18,24 Measuring the peripapillary total retinal thickness may be even more sensitive in detecting mild papilledema than the measurement of RNFL thickness alone.25,26 While there was a statistically significant increase in overall diagnostic accuracy in the intervention group vs. the control group, there was a relative loss in the diagnostic accuracy in critical cases. Our study suggests that the assessment of an isolated structural feature from OCT line scans previously described by Johnson et al and Flores-Rodriguez does not aid differential diagnosis in the absence of a full spectrum of clinical information of optic disc elevation.8,24 It may, in fact, decrease diagnostic accuracy, possibly due to over-interpretation of isolated information or, alternatively, due to the limited experience of participating optometrists with performing OCT scans at all during their practice.
A similar observation was made in a previous study by Kulkarni et al,27 who investigated the effect of extensive tutorials in the differentiation between mild papilledema and buried ONHD on the basis of OCT images and RNFL measurements. It should be highlighted that the conclusions of this study were based on results from five participating clinicians only and all presented eyes were pathological with the exception of two ONHD cases, which had one unaffected fellow eye each. In contrast, the current study aimed to reflect representative skills of a broad range of optometrists and mimic the prevalence of types of elevated optic discs typically seen in clinical practice in the presence of a reasonably large number of non-pathological discs. Despite significant differences in the design, both studies highlight the limited effect of provided educational material in conjunction with isolated diagnostic parameters, despite OCT imaging being increasingly used in general practice.
Australian and New Zealand optometrists in the control and intervention groups of the current study had similar age distribution and experience levels. A web-based survey was utilized to enable convenient access for the participants, and we assumed that practicing optometrists in Australia and New Zealand possess core skills relating to the interpretation of OCT. Questions we posed to study participants included whether they felt self-confident in the interpretation of OCT scans, number of OCT scans performed per week, and if they were therapeutically endorsed. While diagnostic accuracy was correlated with self-reported experience with OCT scans, none of the parameters was found to have an impact on the comparison between the control and intervention groups, perhaps reflecting an overall lack of knowledge base regarding imaging techniques. This result is contrary to previous studies in which TE impacted results.28,29 This is likely a consequence of the current study assessing a clinical skill as opposed to theoretical skills, further supported by the number of OCT scans performed by participating optometrists being associated with the number of correct diagnoses obtained from OCT line scans. Thus, short-term didactic training may be more effective when the teaching is combined with standard clinical training techniques and a sound understanding of the constraints of imaging technology.5,30,31
While some combinations of clinical tests and education can improve sensitivity and maintain or improve specificity,4,32,33 the 4% significant difference between our control and intervention groups was caused by preventing a decrease in incorrect diagnoses with the addition of OCT line scans possibly counteracting some of the inexperience with interpretation of this technique. The concurrent 30% loss in correct papilledema diagnoses could be a consequence of the relatively small number of pathological discs within the case series, which aimed to provide a more realistic representation of the number of papilledema cases seen in clinical practice, a subset of patients with idiopathic intracranial hypertension.34 Alternatively, it could reflect over-confidence by the participants or lack of feedback during the case series, leading to a less conservative decision after integrating the provided education material on a specific image feature.35-37
Interestingly, while diagnostic accuracy of pathological optic discs decreased, diagnostic accuracy in the identification of non-pathological optic discs improved in the intervention compared to the control group. This suggests that adjunct techniques and educational information have the potential to positively impact the false positive rate. This improvement, however, may be at the expense of the incorrect diagnosis of pathologies, an undesirable outcome in critical cases.5 Even though the educational material was reduced to information on a single image feature described by Johnson et al,8 it did reduce the variability in accuracy within the intervention cohort, a result also achieved by long-term programs targeting unification of originally diverse cohorts.38 Overall, however, the outcomes highlight the difficulties in providing guidance on isolated diagnostic parameters in the education on OCT interpretation in lieu of comprehensive clinical training. Clinical assessment for potential ODE or ONHD should include B-Scan ultrasonography, the current gold standard for ONHD diagnosis, or short-wave fundus autofluorescence (SW-FAF), which is considered the least invasive way to detect ONHD owing to its ability to cause the drusen to appear hyper-autofluorescent.39,40 SW-FAF indeed has had the highest sensitivity and specificity in differentiating ONHD from papilledema on red and green filters.41 Most importantly, technological advances need to be assimilated into an existing knowledge base rather than taught as an isolated diagnostic skill.4,42,43 It may be that short-term training is inadequate and that more extensive, continued training is required to improve the diagnostic accuracy of clinicians.44-46 Integration of potentially more successful teaching strategies, such as extensive long-term training on OCT interpretation, increased exposure to new technology, and performance feedback prior to final assessments might need to be considered in the future. Former use of technology, group learning activities and instructor feedback in particular have been identified as key to successful online education.47-48
Limitations of the study
This study was limited to the investigation of an isolated clinical test parameter, which cannot reflect actual diagnostic accuracy achieved in a clinical setting. Furthermore, as the OCT line scans were chosen by optometrists who were aware of the diagnosis, a potential selection bias could have been present. OCT scans were reduced to a single line scan to provide optimal and standardized visualization for all participants and enable direct comparison to previous published images.8 Because the case series was deployed online, we could not control for the screen resolution or environment used to view the images. In addition, time allowed by participants in the intervention group to study differential diagnosis using the provided details on OCT interpretation may have varied.
The concept of the usefulness of OCT for diagnosis of pathological optic discs was comparatively short to avoid unreasonable time constraints, and participating optometrists were not provided with sample questions on which to practice their skills or interactive feedback prior to being assessed. The educational material provided was limited to the description of a single, isolated imaging feature. Future studies will focus on expanded provision of educational materials through integration of related diagnostic markers, such as RNFL thickness measurements and optimized educational intervention to increase consistency of knowledge acquisition.
As with any anonymous online study, we also cannot control potential self-selection bias. Basic characteristics of participants reflecting their clinical experience, such as TE, the number of OCT scans performed per week, and self-reported confidence with OCT did not differ between the control and intervention groups. However, the information provided by participating optometrists did indicate a lack of familiarity with the assessed technique, which could significantly hamper its use to support clinical diagnosis.
Conclusion
This study highlights the potential pitfalls in applying simplified diagnostic principles, such as isolated image features, which can have no or negative impact on sensitivity. While OCT is becoming an integral tool in daily clinical optometric practice, interpretation of results should only be undertaken by appropriately trained practitioners in conjunction with comprehensive clinical data. As a consequence, professionals should be encouraged to continuously expand their care knowledge base through comprehensive, contemporary education to ensure integration of fast advancing technology for optimal diagnostic outcomes.
Acknowledgements
This work was supported, in part, by a grant from the National Health and Medical Research Council of Australia (1033224) and Centre for Eye Health – an initiative of UNSW Sydney Australia and Guide Dogs NSW/ACT. Guide Dogs NSW/ACT is also a partner on the NHMRC grant. Dr Zangerl holds a Faculty Research Grant awarded by the School of Optometry and Vision Science, UNSW Sydney.
References
- Chiang J, Wong E, Whatham A, Hennessy M, Kalloniatis M, Zangerl B. The usefulness of multimodal imaging for differentiating pseudopapilledema and true swelling of the optic nerve head: a review and case series. Clin Exp Optom. 2015;98:12-24.
- Karam EZ, Hedges TR. Optical coherence tomography of the retinal nerve fiber layer in mild papilledema and pseudopapilledema. Br J Ophthalmol. 2005;89:294-298.
- Kim KE, Jeoung JW, Park KH, Kim DM, Kim SH. Diagnostic classification of macular ganglion cell and retinal nerve fiber layer analysis: differentiation of false-positives from glaucoma. Ophthalmology. 2015;122:502-510.
- Andersson S, Heijl A, Boehm AG, Bengtsson B. The effect of education on the assessment of optic nerve head photographs for the glaucoma diagnosis. BMC Ophthalmol. 2011;11:12.
- Chong GT, Lee RK. Glaucoma versus red disease: imaging and glaucoma diagnosis. Curr Opin Ophthalmol. 2012;23:79-88.
- Hood DC, Raza AS. On improving the use of OCT imaging for detecting glaucomatous damage. Br J Ophthalmol. 2014;98 Suppl 2:ii1-9.
- Kunz R, Wegscheider K, Fritsche L, Schunemann HJ, et al. Determinants of knowledge gain in evidence-based medicine short courses: an international assessment. Open Med. 2010;4:e3-e10.
- Johnson LN, Diehl ML, Hamm CW, Sommerville DN, Petroski GF. Differentiating optic disc edema from optic nerve head drusen on optical coherence tomography. Arch Ophthalmol. 2009;127:45-49.
- Lee KM, Woo SJ, Hwang JM. Differentiation of optic nerve head drusen and optic disc edema with spectral-domain optical coherence tomography. Ophthalmology. 2011;118:971-977.
- Martinez MR, Ophir A. Optical coherence tomography as an adjunctive tool for diagnosing papilledema in young patients. J Pediatr Ophthalmol Strabismus. 2011;48:174-181.
- Barboni P, Savini G, Valentino ML, Montagna P, et al. Retinal nerve fiber layer evaluation by optical coherence tomography in Leber’s hereditary optic neuropathy. Ophthalmology. 2005;112:120-126.
- Katz BJ, Pomeranz HD. Visual field defects and retinal nerve fiber layer defects in eyes with buried optic nerve drusen. Am J Ophthalmol. 2006;141:248-253.
- Medeiros FA, Moura FC, Vessani RM, Susanna R, Jr. Axonal loss after traumatic optic neuropathy documented by optical coherence tomography. Am J Ophthalmol. 2003;135:406-408.
- Medeiros FA, Zangwill LM, Bowd C, Weinreb RN. Comparison of the GDx VCC scanning laser polarimeter, HRT II confocal scanning laser ophthalmoscope, and stratus OCT optical coherence tomograph for the detection of glaucoma. Arch Ophthalmol. 2004;122:827-837.
- Menke MN, Feke GT, Trempe CL. OCT measurements in patients with optic disc edema. Invest Ophthalmol Vis Sci. 2005;46:3807-3811.
- Roh S, Noecker RJ, Schuman JS, Hedges TR, 3rd, Weiter JJ, Mattox C. Effect of optic nerve head drusen on nerve fiber layer thickness. Ophthalmology. 1998;105:878-885.
- Savini G, Bellusci C, Carbonelli M, Zanini M, Carelli V, Sadun AA, Barboni P. Detection and quantification of retinal nerve fiber layer thickness in optic disc edema using stratus OCT. Arch Ophthalmol. 2006;124:1111-1117.
- Scott CJ., Kardon RH, Lee AG, Friese L, Wall M. Diagnosis and grading of papilledema in patients with raised intracranial pressure using optical coherence tomography vs clinical expert assessment using a clinical staging scale. Arch Ophthalmol. 2010;128:705-711.
- Frisen L, Holmegaard L. Spectrum of optic nerve hypoplasia. Br J Ophthalmol. 1978;62:7-15.
- Chiang J, Yapp M, Ly A, Hennessy M, Kalloniatis M, Zangerl B. Retinal nerve fiber layer protrusion associated with tilted optic discs. Optometry and Vision Science. 2018 Mar;95(3):239-246.
- Yapp M, Rennie G, Hennessy M, Kalloniatis M, Zangerl B. The impact of optic nerve and related characteristics on disc area measurements derived from different imaging techniques. PLOS ONE. 2018 January:e0190273.
- Brito PN, Vieira MP, Falcao MS, Faria OS, Falcao-Reis F. Optical coherence tomography study of peripapillary retinal nerve fiber layer and choroidal thickness in eyes with tilted optic disc. J Glaucoma. 2013 February 19 [Epub ahead of print].
- Vongphanit J, Mitchell P, Wang JJ. Population prevalence of tilted optic disks and the relationship of this sign to refractive error. Am J Ophthalmol. 2002;133:679-685.
- Flores-Rodriguez P, Gili P, Martin-Rios MD. Sensitivity and specificity of time-domain and spectral-domain optical coherence tomography in differentiating optic nerve head drusen and optic disc edema. Ophthalmic Physiol Opt. 2012;32:213-221.
- Ophir A, Karatas M, Ramirez JA, Inzelberg R. OCT and chronic papilledema. Ophthalmology. 2005;112:2238.
- Vartin CV, Nguyen AM, Balmitgere T, Bernard M, Tilikete C, Vighetto A. Detection of mild papilledema using spectral domain optical coherence tomography. Br J Ophthalmol. 2012;96:375-379.
- Kulkarni KM, Pasol J, Rosa PR, Lam BL. Differentiating mild papilledema and buried optic nerve head drusen using spectral domain optical coherence tomography. Ophthalmology. 2014;121:959-963.
- Jamous KF, Kalloniatis M, Hayen A, Mitchell P, Stapleton FJ, Zangerl B. Application of clinical techniques relevant for glaucoma assessment by optometrists: concordance with guidelines. Ophthalmic Physiol Opt. 2014;34:580-591.
- Zangerl B, Hayen A, Mitchell P, Jamous KF, Stapleton F, Kalloniatis M. Therapeutic endorsement enhances compliance with national glaucoma guidelines in Australian and New Zealand optometrists. Ophthalmic Physiol Opt. 2015;35:212-224.
- Reus NJ, Lemij HG, Garway-Heath DF, et al. Clinical assessment of stereoscopic optic disc photographs for glaucoma: the European Optic Disc Assessment Trial. Ophthalmology. 2010;117:717-723.
- Vessani RM, Moritz R, Batis L, Zagui RB, Bernardoni S, Susanna R. Comparison of quantitative imaging devices and subjective optic nerve head assessment by general ophthalmologists to differentiate normal from glaucomatous eyes. J Glaucoma. 2009;18:253-261.
- Margolis KL, Money BE, Kopietz LA, Rich EC. Physician recognition of ophthalmoscopic signs of open-angle glaucoma: effect of an educational program. J Gen Intern Med. 1989;4:296-299.
- Yoshioka N, Wong E, Kalloniatis M, Yapp M, Hennessy M. Influence of education and diagnostic modes on glaucoma assessment by optometrists, Ophthalmic Physiol Opt. 2015 Nov;35(6):682-98.
- Radhakrishnan K, Thacker AK, Bohlaga NH, Maloo JC, Gerryo SE. Epidemiology of idiopathic intracranial hypertension: a prospective and case-control study. J Neurol Sci. 1993;116:18-28.
- Berner ES, Graber ML. Overconfidence as a cause of diagnostic error in medicine. Am J Med. 2008;121:S2-23.
- Croskerry P, Norman G. Overconfidence in clinical decision making. Am J Med. 2008;121:S24-29.
- Schiff GD. Minimizing diagnostic error: the importance of follow-up and feedback. Am J Med. 2008;121:S38-42.
- Sheen NJ, Morgan JE, Poulsen JL, North RV. Digital stereoscopic analysis of the optic disc: evaluation of a teaching program. Ophthalmology. 2004;111:1873-1879.
- Kurz-Levin MM, Landau K. A comparison of imaging techniques for diagnosing drusen of the optic nerve head. Arch Ophthalmol. 1999;17:1045-1049.
- Lam BL, Morais CG, Jr., Pasol J. Drusen of the optic disc. Curr Neurol Neurosci Rep. 2008;8:404-408.
- Gili P, Flores-Rodriguez P, Yanguela J, Orduna-Azcona J, Martin-Rios MD. Sensitivity and specificity of monochromatic photography of the ocular fundus in differentiating optic nerve head drusen and optic disc edema: optic disc drusen and edema. Graefes Arch Clin Exp Ophthalmol. 2013;251:923-928.
- Law SK, Tamboli DA, Ou Y, Giaconi JA, Caprioli J. Development of a resident training module for systematic optic disc evaluation in glaucoma. J Glaucoma. 2012;21:601-607.
- Myint J, Edgar DF, Murdoch IE, Lawrenson JG. The impact of postgraduate training on UK optometrists’ clinical decision-making in glaucoma. Ophthalmic Physiol Opt. 2014;34:376-384.
- Theodossiade J, Murdoch I, Cousens S. Glaucoma case finding: A cluster-randomised intervention trial. Eye (Lond). 2004;18:483-490.
- Patel UD, Murdoch IE, Theodossiades J. Glaucoma detection in the community: does ongoing training of optometrists have a lasting effect? Eye (Lond). 2006;20:590-594.
- Roberts HW, Rughani K, Syam P, Dhingra S, Ramirz-Florez S. The Petersborough scheme for community specialist optometrists in glaucoma: results of 4 years of a two-tiered community-based assessment and follow-up service. Curr Eye Res. 2015;40:690-696.
- Sharma P, Maleyeff J. Internet education: potential problems and solutions. International Journal of Educational Management. 2003;17(1):19-25.
- 48. Volery T, Lord D. Critical success factors in online education. International Journal of Educational Management. 2000;14(5):216-223.
 Appendix A. |
 Appendix B. Click to enlarge |
 Appendix C. |