PEER REVIEWED
GRIT Survey Score in First-Year Optometry Students:
Pre-COVID vs. Mid-COVID
Patricia M. Cisarik, OD, PhD, FAAO
Abstract
This study examined self-reported resilience in first-year optometry students using Duckworth’s GRIT survey. Early in 2022, first-year students were given 2 weeks to voluntarily respond to the digitally administered survey (10 items). One-way ANOVA was used to compare mean GRIT score for 2022 with the scores for first-year students in 2017 and 2018 available from earlier studies. The difference in mean GRIT score was significant across years, with post hoc analysis finding a difference between 2022 and both 2017 and 2018, but not between 2017 and 2018. Whether the change in self-reported resilience has practical implications for future performance merits attention.
Key Words: GRIT, resilience, pandemic, first-year students, healthcare students
Introduction
In her book “GRIT: The Power of Passion and Perseverance,” Angela Duckworth, PhD, describes her theory of how a willingness to persevere in pursuit of long-term goals is among the most important predictors of an individual’s success.1 (“GRIT = “growth,” “resilience,” “intrinsic motivation” and “tenacity.”) To test her theory, Duckworth created a “GRIT” survey and administered the survey to several populations, including West Point cadets and University of Pennsylvania undergraduate students. Her results showed that their GRIT scores were just as powerful at predicting success in their programs as measures that are believed to reflect natural aptitude, such as the Scholastic Aptitude Test. Although her work has undergone much scrutiny,2-4 the concept that passion and perseverance play significant roles in success pervades.
Other researchers have used Duckworth’s survey and other perseverance assessment tools to explore the concept of GRIT in various student populations. Bowman et al. found that “perseverance of effort predicted greater academic adjustment, college grade point average, college satisfaction, sense of belonging, faculty-student interactions and intent to persist …”5 With respect to academic achievement in graduate rehabilitation science programs (physical therapy, occupational therapy, speech-language pathology), a systematic review/meta-analysis revealed that GRIT has a moderate, positive, significant correlation with academic performance.6 Cisarik showed similar GRIT scores across two consecutive classes of first-year students in an optometry program, demonstrating consistency in the degree of self-reported persistence as measured with Duckworth’s survey early in the academic career for this profession.7 Cheung et al. found that lower GRIT scores were associated with adverse childhood events in a group of university students recruited for the study from 12 universities.8 Lee et al. demonstrated that GRIT is not a fixed personality characteristic, as the score can be enhanced with participation and advancement in taekwondo.9 Others have shown a positive association between teacher-student rapport and GRIT.10
According to Duckworth’s original publication, perseverance to accomplish long-term objectives requires endurance when circumstances are difficult.11 The persistence of the global COVID-19 pandemic offers an opportunity to examine the effects on long-term stress and uncertainty on perseverance. Using Duckworth’s GRIT survey, we compared the self-reported measures of perseverance of first-year students in the optometric program in early 2022 (mid-COVID pandemic) with scores from two classes of pre-COVID-19 first-year optometry students.12,13
Methods
The research protocol conformed to the tenets of the Declaration of Helsinki, and the Institutional Review Board (IRB) of Southern College of Optometry (SCO) determined that the survey methodology qualified this study for exemption from IRB review.
As part of an optional extra-credit activity (one point toward the final course grade that could not be used to pass the course as a whole) for the visual sensation and perception course at SCO, 137 students in the first year of the program in the spring semester of 2022 were invited to take the GRIT survey designed by Dr. Duckworth. The survey was administered electronically using the Google Forms platform. The instructions given in writing before the survey questions were as follows:
This survey was created by Angela Duckworth, author of “GRIT: The Power of Passion and Perseverance.” Read each sentence, then select the choice that best describes you relative to the sentence. Don’t overthink the questions. Just ask yourself how you compare to “most people” (not just how you compare to your family, friends or co-workers). All answers are required.
Students were told that the survey would take approximately 10-15 minutes to complete and were given 2 weeks to respond. Only one set of responses was accepted per student. If a student signed on more than one time to complete the survey, only the first completion (identified by a time stamp) was used in the analysis.
Statistical analysis was performed using SPSS (v.26.0) to compare the GRIT survey scores for the first-year students in 2022 with the scores of the first-year students in the optometry program at SCO in 2017 and 2018 that had been obtained for other studies.12,13
Results
A total of 132 first-year students in the spring of 2022 responded to the survey. The proportions of respondents for 2017, 2018 and 2022, respectively, were 100% (all 132 students), 93.3% (126 of 135 students) and 96.4% (132 of 137 students). The respondents for 2022 had completed one semester of online-only lecture courses and in-person labs with reduced lab class size and other COVID safety protocols in place. The respondents for 2017 and 2018 had completed one semester with access to both in-person real-time lectures and recorded lectures as well as full-sized lab classes (28-30 students per lab section) during the semester prior to the collection of their GRIT survey responses.

Figure 1. Error bars represent the standard error (SE) of the mean. See text for statistical analysis.
Click to enlarge
Figure 1 shows the comparison of the mean GRIT scores (± 2 standard error, SE) across the three groups. The mean GRIT scores (standard deviation, SD) for 2017, 2018 and 2022, respectively, were 3.79 (0.47), 3.70 (0.47) and 3.55 (0.53). One-way ANOVA test indicated that the means of the GRIT scores for the three groups were significantly different (F = 8.51, 2-tailed p < .001). Post hoc analysis using Tukey’s test indicated that mean GRIT score for 2022 was significantly different (lower) from that of 2017 (p < .001, 95% CI = [-.38, .-10]) and 2018 (p = .03, 95% CI = [-.30, -.01]), but the mean GRIT score for 2017 was not significantly different from the 2018 score (p = .311, 95% CI = [-.05, .23]).
Independent samples Kruskal-Wallis test was used to compare the distribution of responses to individual survey items across the years of survey administration, and the results for the items with significant differences between 2022 and the other two years are presented in Figure 2. Differences were found for item 1, “New ideas and projects sometimes distract me from previous ones” (Figure 2a, test statistic = 11.96, 2-tailed p = .003); item 8, “I am diligent. I never give up” (Figure 2b, test statistic = 14.68, 2-tailed p < .001); and item 9, “I have been obsessed with a certain idea or project for a short time, but later lost interest” (Figure 2c, test statistic = 17.86, 2-tailed p <. 001).
 Figure 2a. The distribution of responses for item 1 (and items 8 and 9) on the GRIT survey was significantly different across classes. Click to enlarge |
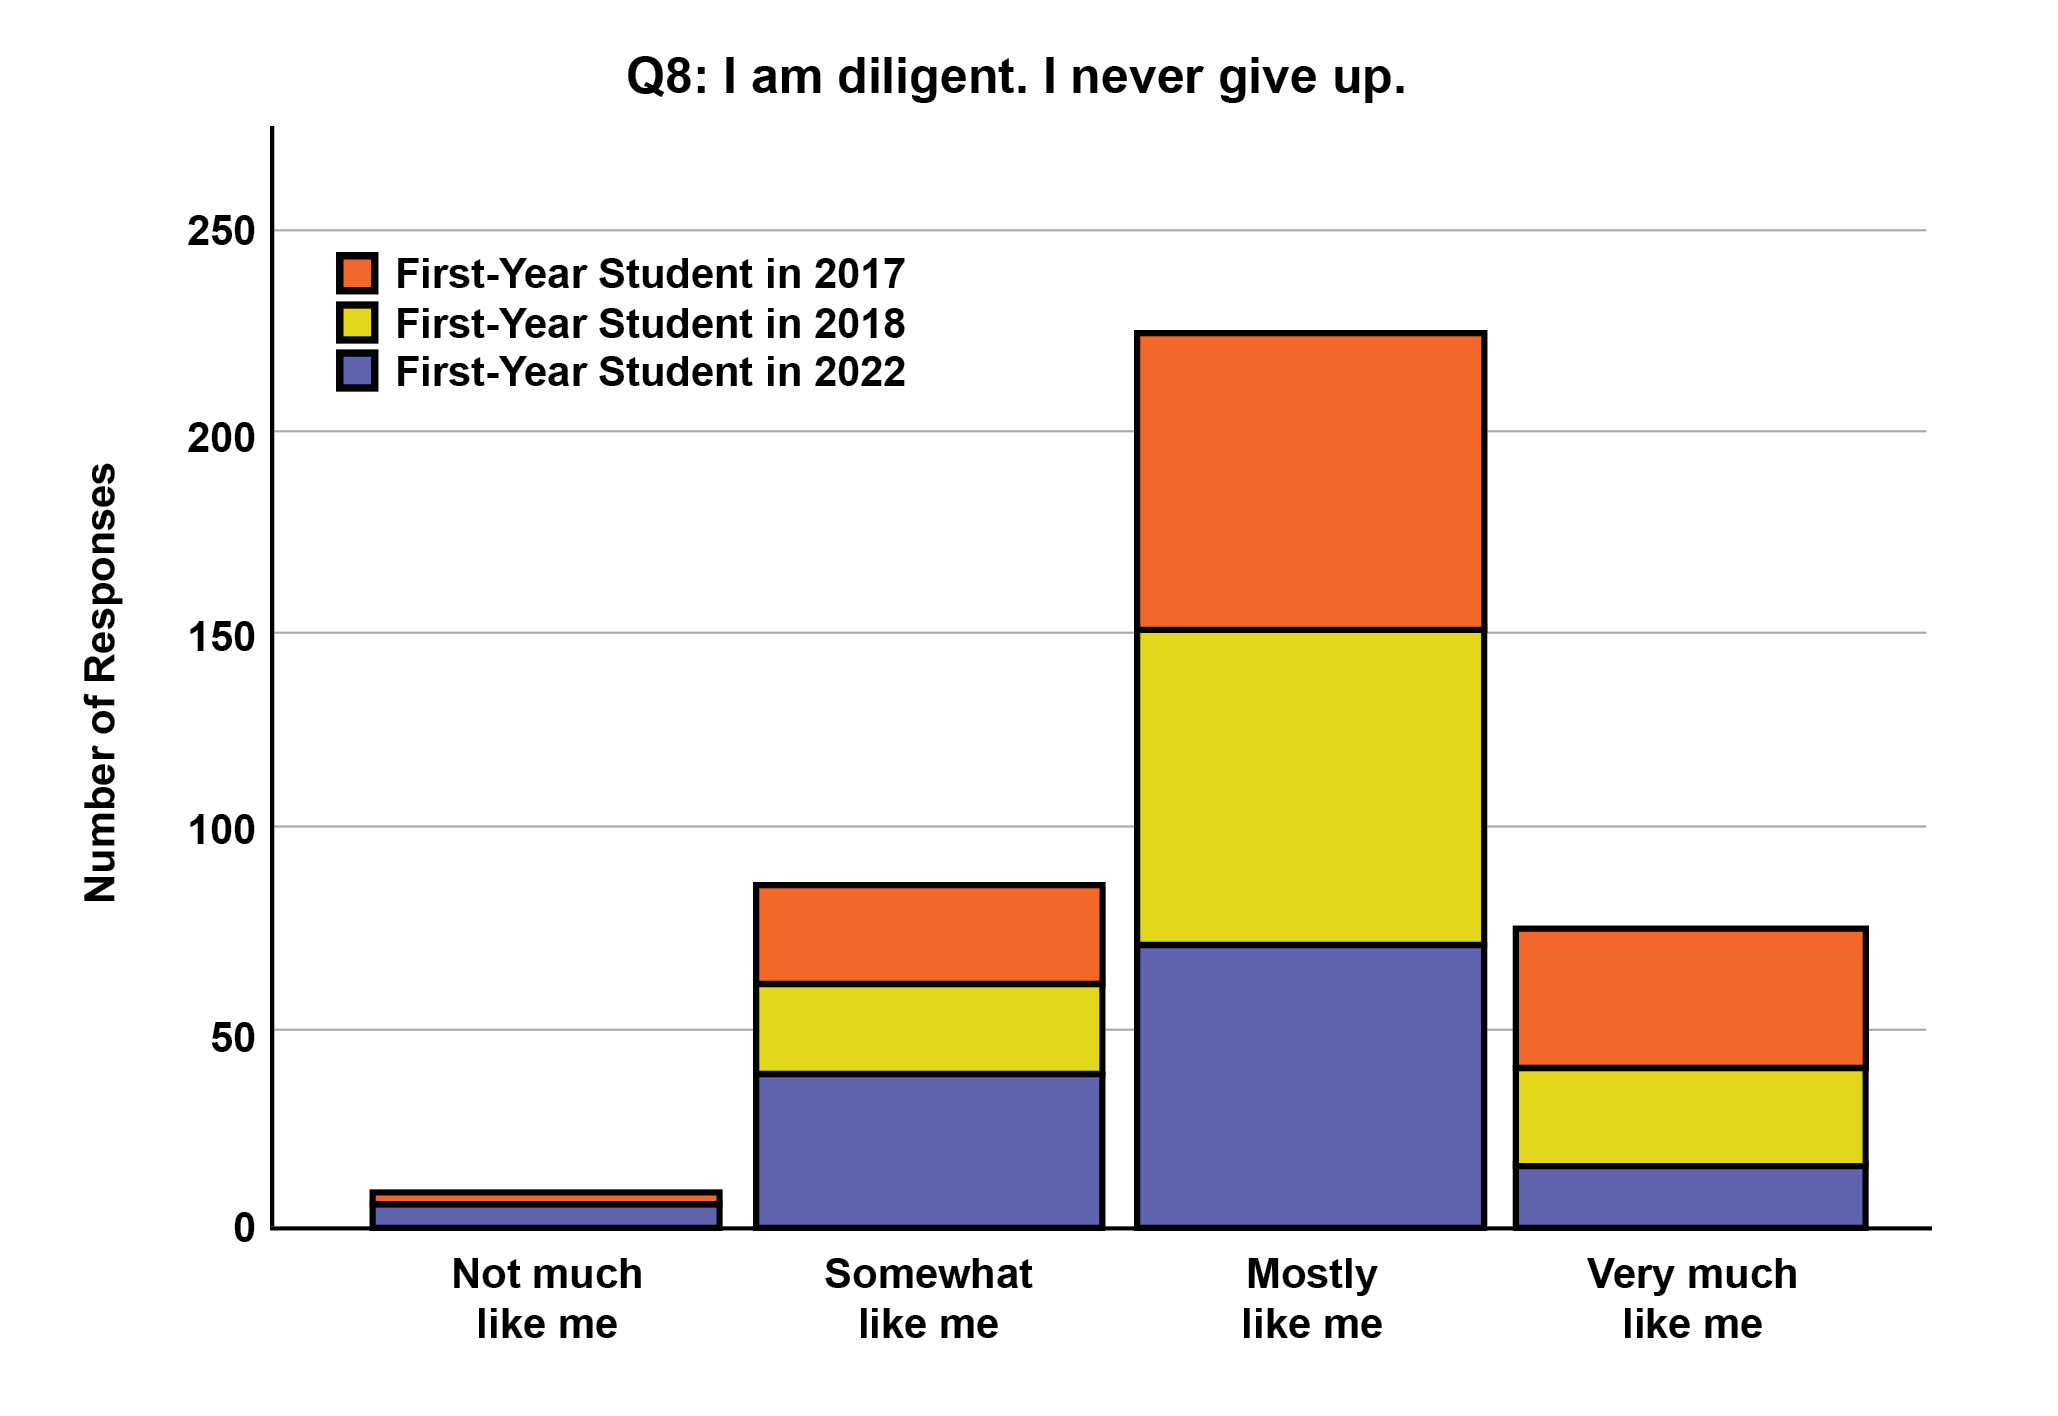 Figure 2b. The distribution of responses for item 8 (and items 1 and 9) on the GRIT survey was significantly different across classes. Click to enlarge |
 Figure 2c. The distribution of responses for item 9 (and items 1 and 8) on the GRIT survey was significantly different across classes. Click to enlarge |
Discussion
The main finding of this study is that for first-year students at SCO, the mean GRIT score in 2022 was significantly different from the mean GRIT scores in 2017 and 2018; whereas, the mean GRIT scores for 2017 and 2018 did not significantly differ. This difference appears to be attributed to a difference in the distribution of responses across the years to survey items 1, 8 and 9.
The possibility exists that the lower mean GRIT score for the 2022 subjects is an expected statistical variation in the samples drawn from the population, but as evidenced by the minimal overlap of the standard error bars in Figure 1, that likelihood is very small. Given that the academic demographics on matriculation to SCO are similar for the 3 years of first-year students in this study,14 different education experiences or achievement do not explain the differences in mean GRIT scores. We did not query our subjects on factors reported to be associated with GRIT score, such as adverse childhood events,8 recent alcohol or marijuana use15 or socio-economic status,16 but education accomplishment at the time of survey administration was similar across years.11 With the sudden and recent economic decline experienced by many families due to the onset of the COVID-19 pandemic, we cannot rule out the influence that economic hardship may have had on the 2022 GRIT scores.
While many factors outside a specific academic arena are associated with academic success (prior academic achievement, emotional intelligence, motivation, self-regulated socio-cognitive skills, goals orientation),17 studies that have examined the academic environment’s influence on GRIT have identified some areas that may have been adversely influenced by the pandemic. For example, Yuan reported that teacher-student rapport and teacher “stroke” (positive reinforcement of student performance) both were positively associated with learners’ GRIT.10 Whether consciously or unconsciously, instructors at SCO may not be engaging with students mid-COVID to the same extent as pre-COVID, or the masks and other social-distancing measures may be impeding attempts at student engagement.
Several studies have examined the association between “burnout” or “emotional exhaustion” and measures of perseverance. A survey of emergency department residents in 2016 found that those meeting the criteria for burnout as assessed by the validated Maslach Burnout Inventory had significantly lower mean GRIT scores than those of residents not meeting the criteria for burnout.18 Note that this study was done prior to the COVID-19 pandemic. In 2020 Jumat et al. published a study demonstrating that higher GRIT scores measured at the beginning of the first year appear to protect first-year medical students from experiencing burnout symptoms later in the year.19 Thus, if a similar relationship between GRIT score and future burnout exists for first-year optometry students, our institution may experience the effects of their burnout in the near future, such as lower overall grade point average of graduates, lower national board scores, more students electing to drop from the program, fewer applicants for residency positions (or more applications for residencies if the acquisition of a residency is seen as a buffer against future economic hardship).
A respondent receives between 1 and 5 points for each item on the GRIT survey based on the response chosen for each item. The total number of points for the survey is divided by 10 to calculate the GRIT survey score for an individual respondent. The mean GRIT score of 3.55 (on a scale of 1-5, with 5 representing high GRIT) places the first-year students in 2022 in the 40th percentile by Duckworth’s scale, which was developed based on a large sample of adults. The mean GRIT scores for 2017 and 2018 on this same scale place those groups in the 50th percentile. Both of these mean GRIT score values are lower than the mean value (4.01 ± 0.42) reported for medical students in 2014.20 Whether the significantly different mean GRIT score for the first-year students in 2022 will have practical implications for them or for the institution is unknown. Also unknown is whether the scores for the first-year students in 2022 are actually higher or lower than they would have been if measured immediately upon matriculation. While research involving nursing students has shown improved GRIT score with accomplishment and age,16 no clear relationship between GRIT score and program level manifested (pre-COVID-19) in a cohort of pharmacy students.21
Training to improve one’s resilience is offered by therapists,22 clinics23 and the U.S. Army.24 A meta-analysis of small randomized trials of the efficacy of such programs showed that most of the studies had moderate to high bias.25 Nonetheless, generalized stress-directed programs showed a moderate effect on enhancing resilience.25 In a study with a short-term follow-up, resilience training in healthcare workers in a hospital setting demonstrated that the implemented program was feasible and accepted and generated improved outcomes.26 A separate meta-analysis of studies examining resilience training specifically in healthcare workers found the interventions to have moderate effects on resilience and stress, but the evidence had very low certainty.27 Our previous work showed no relationship between GRIT score and grades in two individual classes.7 Whether a relationship exists between resilience and success in an optometric program as a whole, success on board examinations or success in a post-graduate residency program is unknown. Thus, further research, perhaps using other validated tools for assessing resilience, as well as studies of the effects of specific interventions, is needed before recommendations for resilience training in optometric education can be made.
Alternatively, the lower 2022 GRIT scores may reflect another aspect of the changing demographics of students entering optometry school. The DISC survey is a behavioral/personality self-assessment tool used widely by individuals and organizations to understand how personal behaviors impact communications.28 The “S” component of this tool stands for “steadiness” and reflects the characteristics of patience, collaboration, calm approach and humility.29 While some of these characteristics are desirable in caring for patients, a high score in this section of the survey indicates that the individual prefers to work in the background and to avoid conflict or change.28 This communication style emphasizes cooperation with others within the existing circumstances, as opposed to challenging oneself and others.28 According to Lisa Wade, OD, Director of the Hayes Center for Practice Excellence at SCO, the mean “S” score in the DISC assessment she uses for first-year optometry students at the college continues to trend upward and is well above the national average (personal communication).29A formal comparison of the DISC scores and the GRIT scores in the same group of optometry students could prove informational.
The current study has several limitations. GRIT scores for first-year optometry students at SCO are available for 2017 and 2018, but not for years earlier or later, except for 2022. Thus, we were unable to determine whether the difference observed in the data is likely to be pandemic-related or part of an already-existing trend. Nevertheless, the association between lower GRIT scores and less resilience or higher burnout,17,18 regardless of the influence of the pandemic, suggests that promoting resilience through instructor-student engagement and frequent positive feedback may help to mitigate burnout in optometry students.
Another limitation of this study is that the data were collected from only one optometric program. SCO, as one of the larger optometric programs in the United States, has had an entering class size of approximately 135 for the past two decades. Academic records of matriculating students may vary somewhat across optometric institutions. If the within-institution entering data is similar across years, then any difference in GRIT score trends from the trend reported from the SCO data may be related to class size and, perhaps, a difference in feelings of school connectedness.30 Jorgenson et al. reported that dimensions of school connectedness vary based on student age, with students ages 21-25 experiencing a higher degree of connectedness based on interactions with faculty, rather than with other students.31 Establishing regular faculty-student interactions may be more easily accomplished in environments with fewer total students. Whether any interference in faculty-student interactions caused by adjustments in teaching to accommodate safety protocols related to COVID differed between larger and smaller optometric programs is unknown.
A third limitation of this study is the lack of data collection for assessment of student well-being, such as for depression or anxiety, for any of the study years. A meta-analysis of post-secondary student mental health during COVID-19 revealed pooled prevalence estimates of elevated depressive symptoms in 30.6% and elevated anxiety symptoms in 28.2% of students, unrelated to their level of training.32 With respect to student perceptions of the impact of COVID-19 on their medical education, Haskett et al. found that students with higher GRIT scores reported less anxiety, insomnia and tiredness.33 An understanding of the relationship, if any, between GRIT scores and symptoms of anxiety or depression in optometry students would help determine whether institution-level changes are indicated, or whether interventions on an individual student basis would be more effective.
Conclusion
The assessment of resilience using Duckworth’s GRIT survey in first-year optometry students across several years suggests that the students tested mid-COVID-19 pandemic rate themselves as less “gritty” than first-year optometry students from two different pre-COVID-19 years. Although the factors contributing to this change are uncertain, awareness of the change and of factors that can improve the sense of resilience may be helpful in mitigating undesired academic outcomes or career decisions for optometry students.
References
- Duckworth AL. GRIT: the power of passion and perseverance. New York, NY: Scribner; 2016. 368 p.
- Tyumeneva Y, Kardanova E, Kuzmina Y. GRIT: two related but independent constructs instead of one. Evidence from item response theory. Eur J Psychol Assess. 2019 Aug;35(4):469-78.
- Credé M, Tynan MC, Harms PD. Much ado about GRIT: a meta-analytic synthesis of the GRIT literature. J Pers Soc Psych. 2017 Jun;113(3):492-511.
- Rimfield K, Kovas Y, Dale PS, Plomin R. True GRIT and genetics: predicting academic achievement from personality. J Pers Social Psych. 2016 Nov;111(5):780-89.
- Bowman NA, Hill PL, Denson N, Bronkema R. Keep on truckin’ or stay the course? Exploring GRIT dimensions as differential predictors of educational achievement, satisfaction, and intentions. Soc Psychol Personal Sci. 2015 Aug;6(6):639-645.
- Reynolds K, Bazemore C, Hanebuth C, Hendren S, Horn M. The relationship of non-cognitive factors to academic and clinical performance in graduate rehabilitation science students in the United States: a systematic review. J Educ Eval Health Prof. 2021;18:31.
- Cisarik PM. Comparison of GRIT survey scores and course test scores in two classes of first-year optometry students. Poster session presented at: 97th Annual Conference of the American Academy of Optometry; 2018 Nov 7-10; San Antonio, TX.
- Cheung S, Huang CC, Zhang C. Passion and persistence: investigating the relationship between adverse childhood experiences and GRIT in college students in China. Front Psychol. 2021 Feb 22;12:642956.
- Lee JH, Cho JH, Kwak YS, Ko BG, Cho EH. The relationship between changes in GRIT, taekwondo ability, and academic achievement of university students majoring in science and engineering and participating in taekwondo class. Int J Environ Res Public Health. 2021 May;18(10):5361.
- Yuan L. Enhancing Chinese EFL students’ GRIT: the impact of teacher stroke and teacher-student rapport. Front Psychol. 2022 Jan 21;12:823280.
- Duckworth AL, Peterson C, Matthews MD, Kelly DR. GRIT: perseverance and passion for long-term goals. J Pers Soc Psychol. 2007 Jun;92(6):1087-101.
- Cisarik PM, Elkins L. Comparison of GRIT survey, OAT, undergraduate GPA and VSP test scores in first-year optometry students. Poster presented at: American Academy of Optometry Annual Meeting; Oct 12, 2017; Chicago, IL.
- Cisarik PM. Comparison of GRIT survey scores and course test scores in two classes of First-year optometry students. Poster presented at: American Academy of Optometry Annual Meeting; November 9, 2018; San Antonio, TX.
- Profiles of the Entering Classes [Internet]. Rockville, MD: Association of Schools and Colleges of Optometry; [cited 2022 Feb 14]. Available from: https://optometriceducation.org/future-students/resources/profiles-of-the-entering-classes/.
- Guerrero LR, Dudovitz R, Chung PJ, Dosanjh KK, Wong MD. GRIT: a potential protective factor against substance use and other risk behaviors among Latino adolescents. Acad Pediatr. 2016 Apr;16(3):275-81.
- Terry D, Peck B. Factors that impact measures of grit among nursing students: a journey emblematic of the koi fish. Eur J Investig Health Psychol Educ. 2020 Apr 5;10(2):564-574.
- Gilar-Corbi R, Pozo-Rico T, Castejón J-L, Sánchez T, Sandoval-Palis I, Vidal J. Academic achievement and failure in university studies: motivational and emotional factors. Sustainability. 2020 Nov;12(23):9798.
- Dam A, Perera T, Jones M, Haughy M, Gaeta T. The relationship between GRIT, burnout, and well-being in emergency medicine residents. AEM Educ Train. 2018 Dec;3(1):14-19.
- Jumat MR, Chow PK, Allen JC Jr, et al. Grit protects medical students from burnout: a longitudinal study. BMC Med Educ. 2020 Aug 12;20(1):266.
- Miller-Matero LR, Martinez S, MacLean L, Yaremchuk K, Ko AB. GRIT: a predictor of medical student performance. Educ Health (Abingdon). 2018;31(2):109-113.
- Gruenberg K, Brock T, MacDougall C. Longitudinal associations between GRIT, academic outcomes, and residency match rates among pharmacy students. Am J Pharm Educ. 2019 Aug;83(6):6947.
- Miller R. How resilience training can change your life for the better [Internet, updated July 1, 2022]. Mountain View, CA: BetterHelp; c2022 [cited Sept. 16, 2022]. Available from: https://www.betterhelp.com/advice/resilience/how-resilience-training-can-change-your-life-for-the-better/.
- Resilience training [Internet]. Mayo Foundation for Medical Education and Research; c1998-2022 cited Sept. 16, 2022. Available from: https://www.mayoclinic.org/tests-procedures/resilience-training/about/pac-20394943.
- Master resilience training. US Army; [cited Sept 16. 2022]. Available from: https://www.armyresilience.army.mil/ard/R2/Master-Resilience-Training.html.
- Leppin AL, Bora PR, Tilburt JC, et al. The efficacy of resiliency training programs: a systematic review and meta-analysis of randomized trials. PLoS One. 2014;9(10):e111420. Published 2014 Oct 27.
- Yi-Frazier JP, O’Donnell MB, Adhikari EA, et al. Assessment of resilience training for hospital employees in the era of COVID-19. JAMA Netw Open. 2022 Jul 1;5(7):e2220677.
- Kunzler AM, Helmreich I, Chmitorz A, et al. Psychological interventions to foster resilience in healthcare professionals. Cochrane Database Syst Rev. 2020;7(7):CD012527. Published 2020 Jul 5.
- Discprofile: unlock the potential of your people [Internet]. Chicago: Personality Profile Solutions, LLC; [cited 2022 Feb 2]. Available from: https://www.discprofile.com/.
- Wade L. (Hayes Center for Practice Excellence, Southern College of Optometry, Memphis, TN). Email to: Patricia Cisarik (Southern College of Optometry, Memphis, TN), 2022 Feb 10.
- Han K. Students’ well-being: the mediating roles of GRIT and school connectedness. Front Psychol. 2021 Nov;12:787861.
- Jorgenson DA, Farrell LC, Fudge JL, Pritchard A. College connectedness: the student perspective. J Scholar Teach Learn. 2018 Jan;18(1):75-95.
- Zhu J, Racine N, Xie EB, et al. Post-secondary student mental health during COVID-19: a meta-analysis. Front Psychiatry. 2021 Dec 10;12:777251.
- Haskett LA, Doster DL, Athanasiadis DI, et al. Resilience matters: student perceptions of the impact of COVID-19 on medical education. Am J Surg. 2022 Jul;224(1 Pt B):358-362. Epub 2022 Jan 22.