PEER REVIEWED
The Predictive Value of the Optometry Admission Test in an Evolving Admissions Landscape
Guilherme Albieri, PhD, Christian Alberto, EdD
Abstract
This paper examines whether the Optometric Admission Test (OAT) serves as a reliable predictor of performance in optometry school. This study adds to the body of research providing empirical evidence of the validity of the OAT in predicting various forms of academic performance, including first-year and overall Grade Point Average (GPA) in the professional Doctor of Optometry (OD) program, clinical success, academic underperformance (dismissal or course repetition), and National Board of Examiners in Optometry (NBEO) Part 1 pass rate. Data from enrolled students at a state school of optometry from the class of 2016 to the class of 2024 were included in this study, totaling 848 students. OAT scores were predictive of didactic and clinical GPA, dismissals and repeats, and NBEO Part 1 scores. This study supports using the OAT as a tool in the holistic admissions toolbox, and an indicator for admitting applicants, but not as a standalone reason to reject them.
Keywords
Background
The Optometry Admission Test (OAT) has long been a foundation of the admissions process, but its efficacy in predicting student success is increasingly debated. In an era where the value of standardized testing is under scrutiny across educational disciplines, the optometry community finds itself at a crossroads—to maintain the OAT as an admissions tool or to eliminate it. This paper examines whether the OAT truly serves as a reliable predictor of performance in optometry school.
Common objections to standardized tests in the health professions include: bias against lower economic status students, racially underrepresented students and women, creating unnecessary barriers that limit diversification of the professions; limited predictive value for student success restricted to first- and second-year GPA; and failure to measure non-cognitive factors—such as grit and motivation—that also influence performance in professional school.1–4 It has also been argued that test scores are becoming weaker predictors of success.2,5
Consequently, there have been growing calls to eliminate or reevaluate standardized tests—including the OAT—as admissions requirements.2,3,5,6 In response, many institutions, including some in the health professions, have adopted test-optional admissions policies.5 While the concerns raised against standardized tests are valid, the central question is whether the tests should be abolished entirely or instead reframed and used more judiciously. Notably, some schools that previously removed test requirements are now reinstituting them due to their predictive power, further underscoring the importance of this discussion.7,8
Standardized tests are decision-making tools that provide consistent evidence for stakeholders to select, sort and support candidates. As with any tool, it is important to define their ultimate purpose to determine if the tools are measuring what they are supposed to measure and if decision makers apply the results appropriately. The purpose of the OAT, for instance, is to measure general academic ability, knowledge and comprehension of scientific information, as well as preparedness of students for a rigorous professional education.9,10 Beyond preparedness, some argue that standardized tests offer a fair and objective criterion when selecting candidates in an environment in which the number of qualified candidates exceed the number of available seats.11
Schwartz states that Optometry, as a licensed profession intended to treat and diagnose disease, should be compared to other professions that assign its professionals equal rights and privileges, such as medicine.12 Various studies in the field of medical education have confirmed the validity of standardized tests in predicting academic performance, licensing examination performance and persistence.1,13
Jakirlic et al. pointed out the paucity of studies on the effectiveness of the OAT in predicting performance in optometry school.2 However, the American Dental Association (ADA), which is responsible for administering the OAT, periodically issues an OAT validity study describing the relationship between the OAT and 7 subject areas in optometric education (optics, biomedical science, vision science, ocular health science, clinical science, clinic, other) for 15 optometry schools.14 This validity study, which supports the findings from similar OAT validity studies, concludes that the OAT and undergraduate GPA, taken individually, are reliable predictors of academic success, and that combined, their predictive power increases.13–15 Consequently, the study recommends that colleges of Optometry should consider both GPA and standardized test results when making admissions decisions.
The purpose of this study is to add updated information to the discussion about the power of the OAT to predict academic achievement in optometry school and to address some objections directed at standardized tests. Questions explored by this study include:
- How well do admissions metrics including OAT, Undergraduate GPA and Institutional Rating assess entering students for optometry school readiness and uninterrupted progress?
- How well do admissions metrics assess entering students for NBEO Part 1 readiness?
- How well do admissions metrics assess entering students for Clinical readiness?
Method
Participants
Data from enrolled students at a state school of optometry from the Class of 2016 to the Class of 2024 were included in this study. Admissions metrics were obtained from their admissions files and academic and clinical performance for all 4 years was provided by the registrar’s office. Transfer and advanced standings students were excluded from the analysis.
Sample: In total, 848 students from the classes of 2016 up to the class of 2024 were part of this analysis. The Class of 2016 included 84 new students (9.91%), 2017 had 90 (10.61%), 2018 had 91 (10.73%), 2019 and 2020 each had 99 (11.67%), 2021 had 96 (11.32%), 2022 had 101 (11.91%), 2023 had 98 (11.56%), and 2024 had 90 students (10.61%).
Gender: Females represented 73.1% (620) of the overall sample and males 26.9% (228).
Race and Ethnicity: White students represented 42.7% (362) of the sample, followed by Asian students (41.5%, 352), International students (5.2%, 44), Hispanic students (4.6%, 39), Black/African American students (2.9%, 25), students who identified as two or more races (2.4%, 20), and unknown (0.7%, 6).
Measures and Variables:
- Total ugGPA. Mean grade-point average (GPA) for all undergraduate courses taken by students.
- BCP ugGPA. Mean GPA for all Biology, Chemistry and Physics undergraduate courses.
- Didactic GPA. Mean GPA for all didactic courses completed during Years 1-3, excluding clinical courses and Pass/Fail courses (e.g., Integrative Seminar).
- Overall OD GPA. Mean GPA for every graded course completed in the program, excluding all Pass/Fail courses.
- Clinical GPA. Mean GPA for all clinical courses taken in Years 3 and 4. Students who were dismissed from the program before reaching Year 3 do not have a clinical GPA and were not computed in the Clinical GPA analysis.
- Undergraduate Institutional Rating (UIR). To determine if undergraduate GPA differed by the type of institution attended, students were assigned an Undergraduate Institutional Rating (UIR) score. The UIR score was created based on Barron’s Best University ranking of undergraduate institutions following a 5-point scale, from non-competitive (open admissions) to most competitive. Because international schools are not rated by Barron’s, international students were excluded from the analysis.
- NBEO Part I Scores. Overall composite score for first attempt of the NBEO Part I exam. Scores range from 100 to 900, and a score of 300 or higher indicates passing the exam. Students who were dismissed prior to attempting NBEO Part I, as well as those who voluntarily opted not to take the examination (given that it is not a graduation requirement), were excluded from this analysis.
Normality Testing of Variables: All dependent and independent variables used in the predictive models, including undergraduate GPA, Overall OD GPA, First-Year OD GPA, OAT scores, UIRs and Overall NBEO Part 1 scores were tested for normality using skewness and kurtosis statistics. Skewness and kurtosis values between -1 and +1 were considered acceptable indicators of approximate normality. All measures fell within this range except for Clinical GPA, which showed acceptable skewness but high kurtosis, indicating a non-normal distribution.
Statistical Analysis: This study used various statistical methods to answer the proposed research questions, including descriptive statistics, Pearson correlation coefficients to assess linear relationships between variables, ANOVA to test differences in means, chi-square to test difference between expected and observed frequencies between groups, and regression analysis to determine the linear relationship between independent and dependent variables. Statistical significance was set at p < .05. Because clinical GPA was not normally distributed, an ordinal regression was used. Data analysis was conducted using SPSS.
The study was reviewed and deemed Exempt by the Institutional Review Board (IRB NET ID 2159150-2, approval date June 6, 2024).
Results
Entering Admissions Metrics
OAT. The total mean Academic Average OAT for the sample was 343 ± 21.2, with a range of 280 to 400, and the mean Total Science OAT was 347 ± 27, ranging from 290 to 400.
Undergraduate GPA. The mean Biology, Chemistry and Physics Undergraduate GPA (BCP ugGPA) was 3.42 ± .31 (range 2.44-4.0) and the mean Total ugGPA was 3.54 ± .25 (range 2.74-4.0).
Institutional Ranking. The average institutional rank for all students is 4.3, on a 1-6 scale. Twenty one percent of students are from institutions rated 5 or above, 20% from institutions rated 4-4.9, 19.4% from institutions rated 3-3.99, and 6% from institutions rated below 3.
Performance in the Professional Program
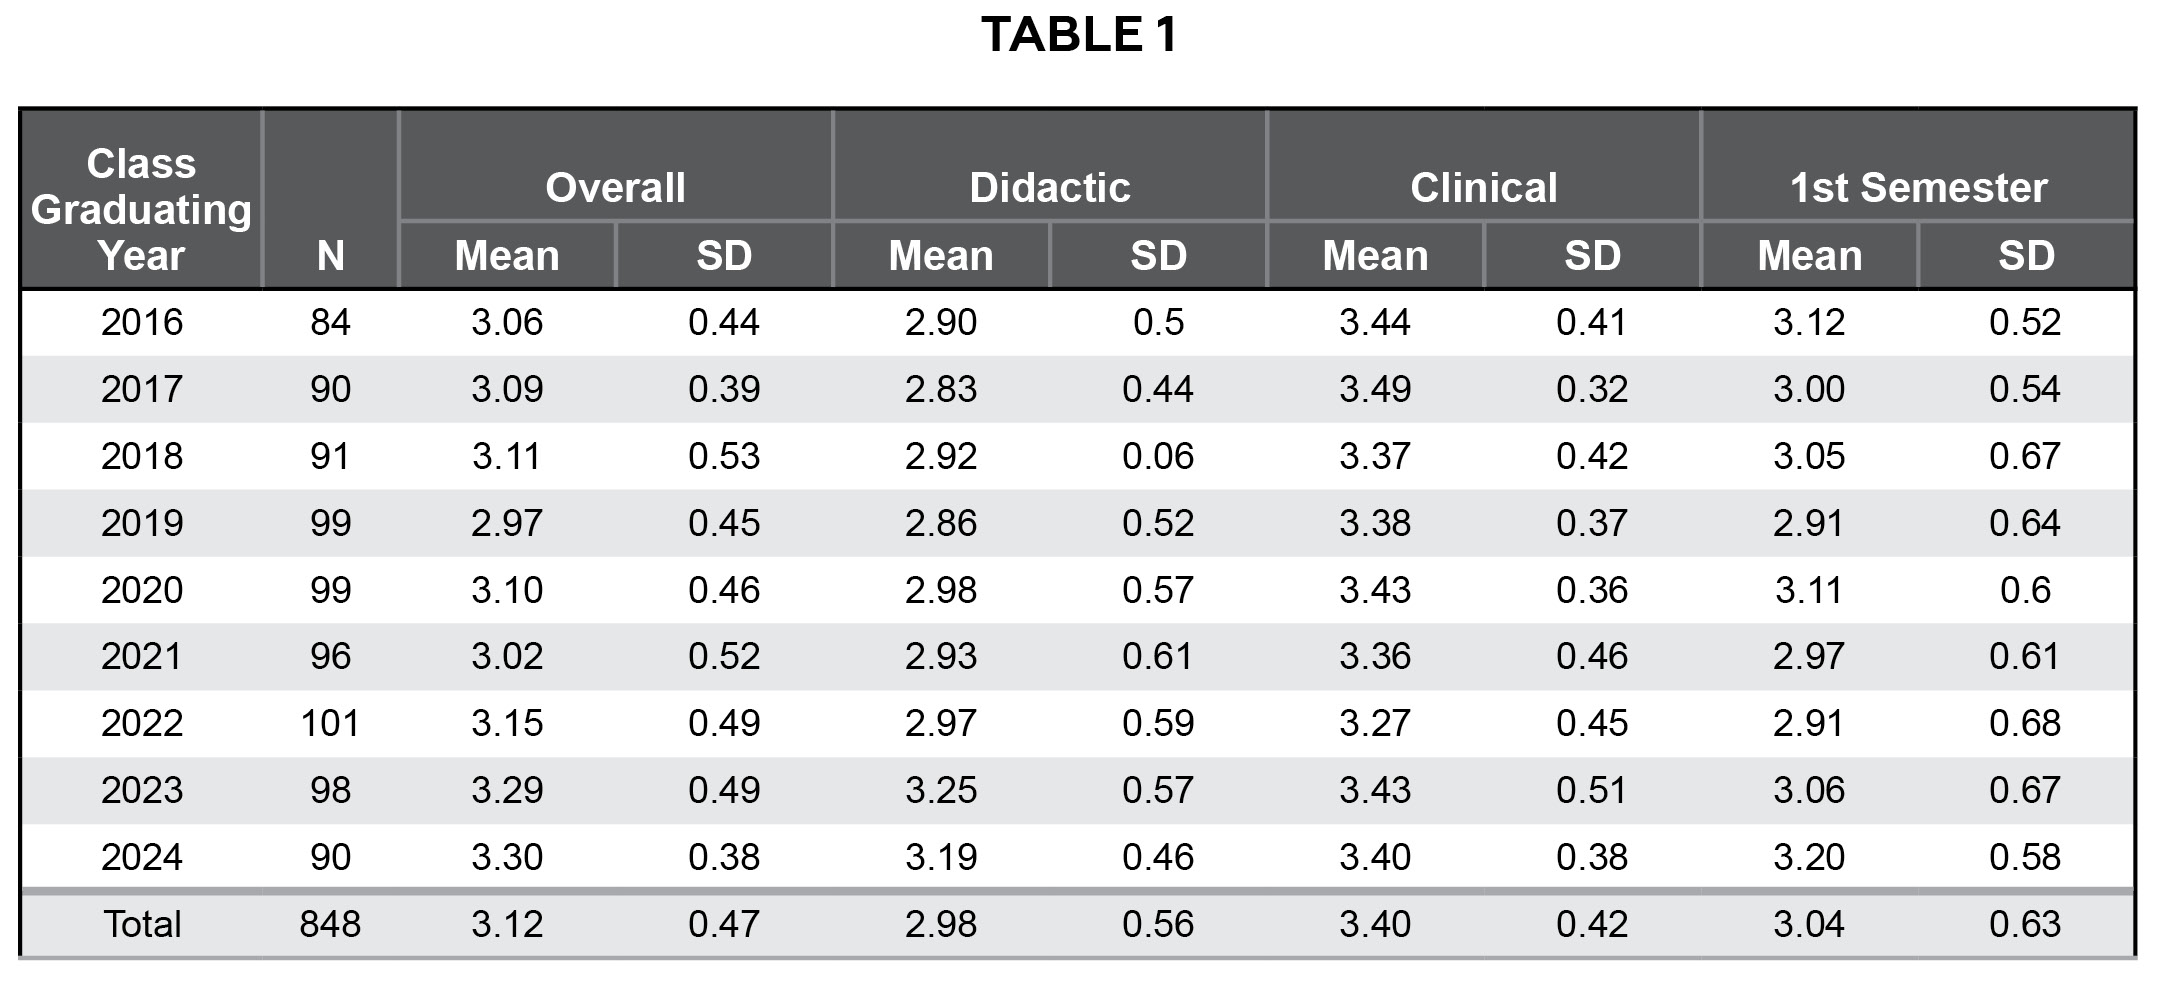
Table 1. Mean of OD GPA by Class Graduating Year. Click to enlarge.
The GPAs for each class can be found on Table 1. The mean Didactic OD GPA—calculated from all didactic courses taken in Years 1-3—is 2.98 ± .56, the mean Overall OD GPA is 3.12 ± .47, the mean Clinical OD GPA is 3.40 ± .42, and the mean First Semester OD GPA is 3.04 ± .63.
OAT and OD GPAs
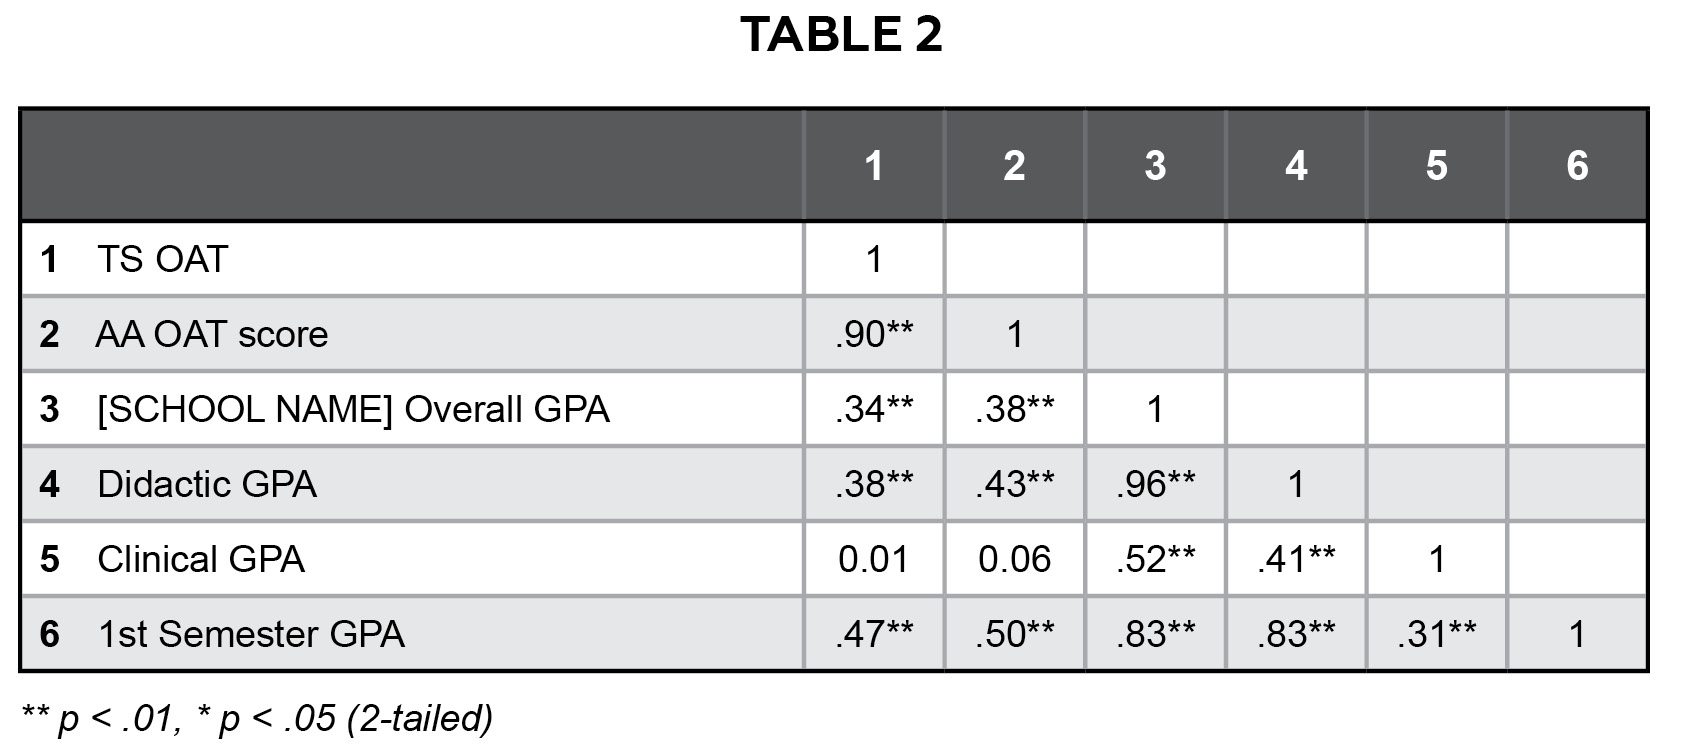
Table 2. Pearson’s Correlation Between OAT (TS and AA) and Various Measures of Performance in the Program. Click to enlarge.
Pearson correlation coefficients were computed to assess the linear relationship between the OAT and various GPAs in the professional OD program. As shown in Table 2, Total Science (TS) and Academic Average (AA) OAT scores correlate positively and significantly with all measures of GPA, except for Clinical OD GPA. The AA OAT had a stronger correlation with all measures of GPA compared to TS. Specifically, AA OAT had the strongest correlation with first-year GPA (r = .47).
Admissions Metrics (OAT, ugGPA, Institutional Rating) as Predictors of Overall OD GPA
A regression analysis was conducted to test the linear relationship between admissions metrics and OD GPA. As seen in Table 3, OAT AA alone explained 14% of the variance in Overall OD GPA, and Total ugGPA explained 11% of the variance.
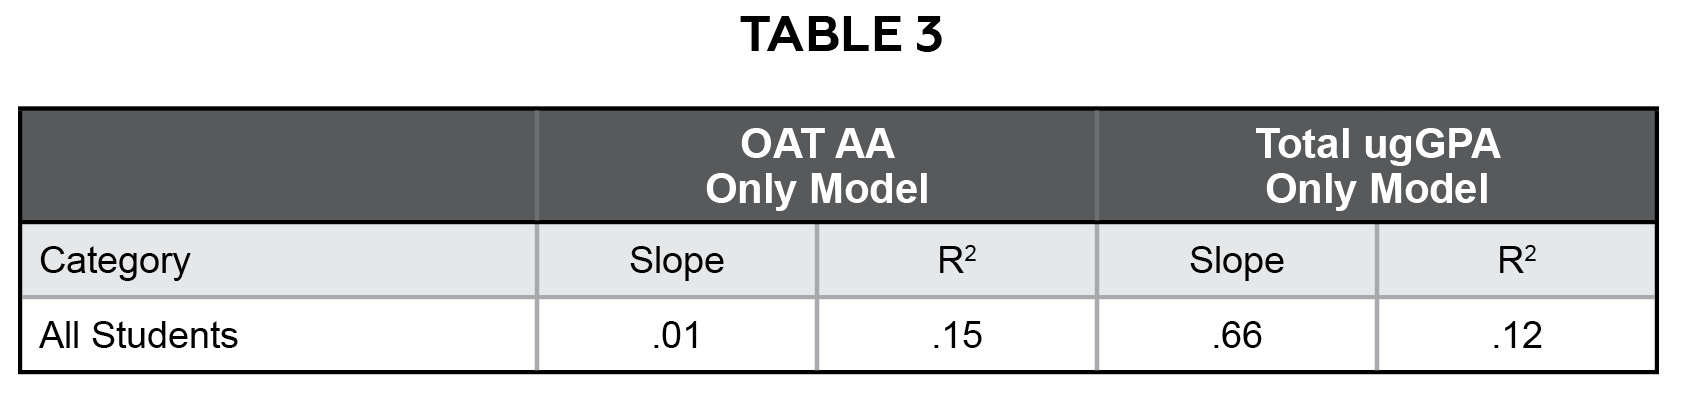
Table 3. Prediction of Overall OD GPA Based on OAT AA and ugGPA. Click to enlarge
Similar patterns emerged when predicting first semester OD GPA (Table 4). OAT AA alone explained 25% of the variance in first semester OD GPA, and Total ugGPA explained 12% of the variance.
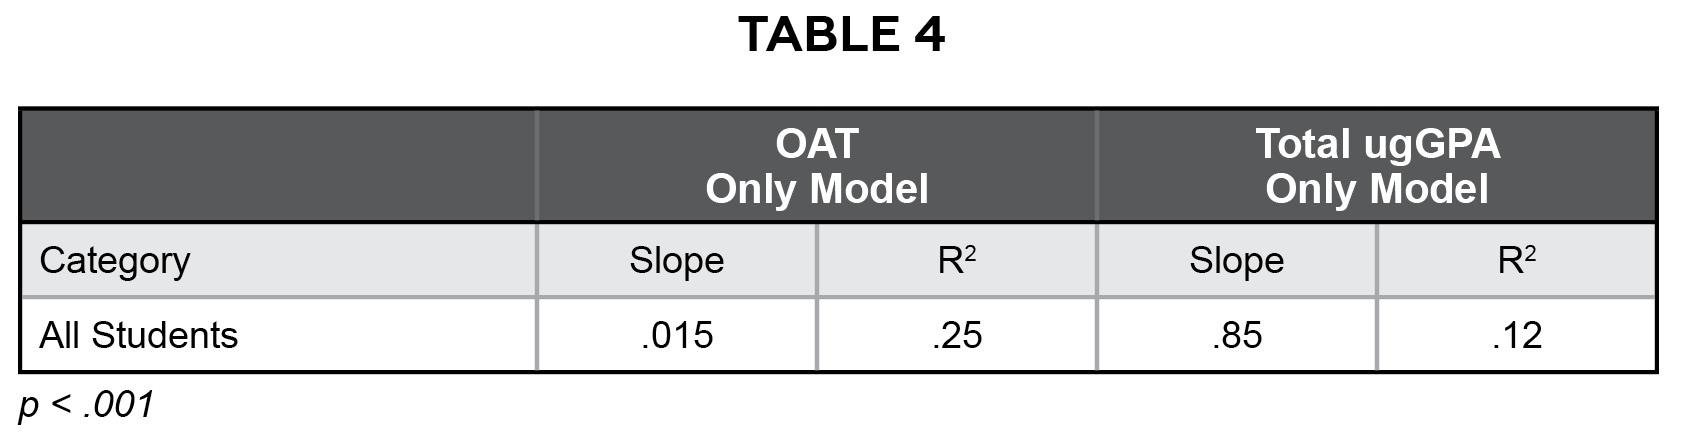
Table 4. Prediction of First Semester OD GPA Based on OAT AA and ugGPA. Click to enlarge
Undergraduate Institutional Ranking
Pearson coefficient correlations were computed to assess the linear relationship between UIR and Admissions Metrics and various GPAs in the professional program. As seen in Table 5, there was a positive correlation between UIR and OAT scores, and all OD GPAs, except for Clinical OD GPA. There was a negative correlation between UIR and ugGPA, both BCP and Total. This is not surprising as more competitive schools are known for being more stringent on grading.
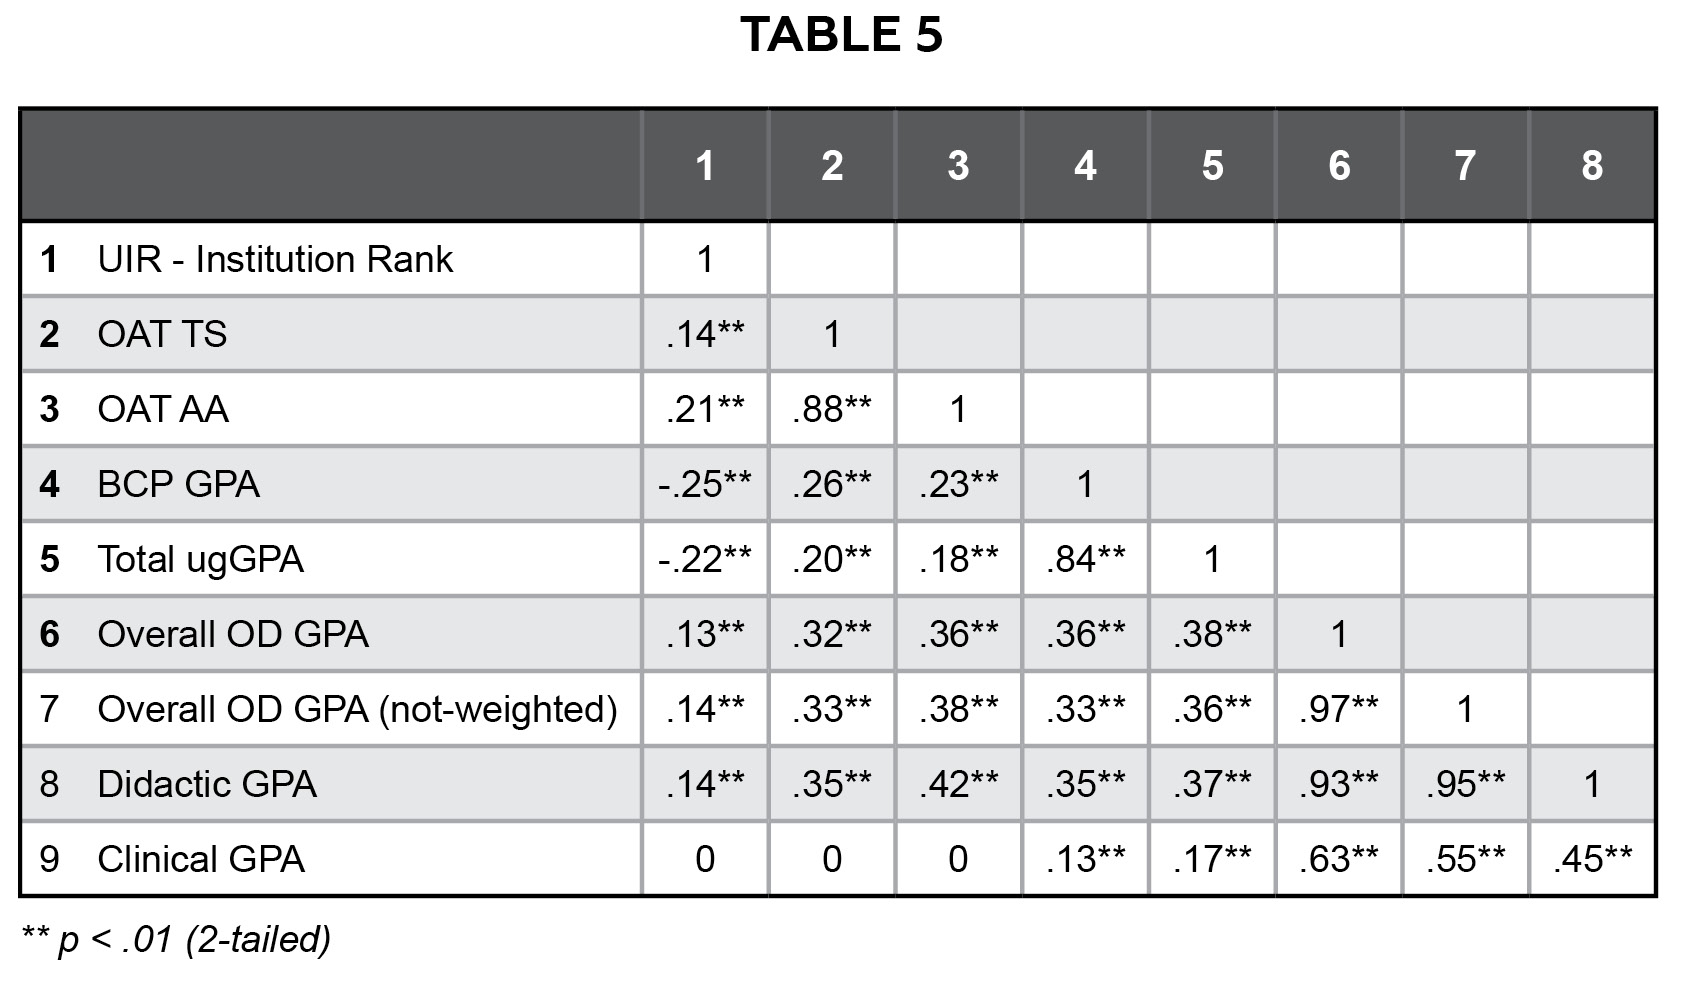
Table 5. Pearsons’ Correlation between Institutional Rank, Admissions Metrics and OD GPAs. Click to enlarge
Relationship Between Overall OD GPA and All Admissions Metrics Combined
Multiple regression analysis was performed to predict Overall OD GPA using three admissions metrics: AA OAT, Total ugGPA and UIR.
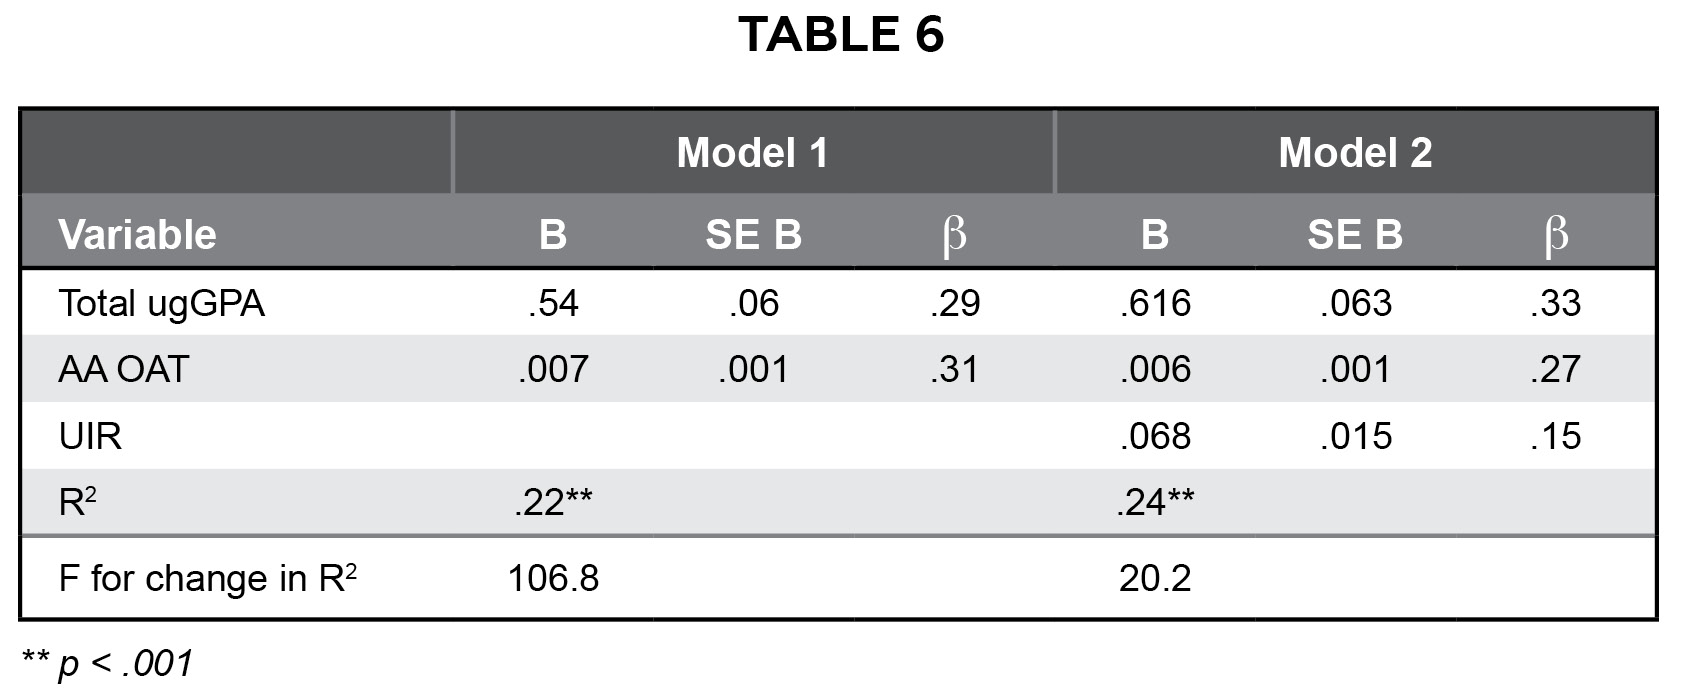
Table 6. Regression of Institutional Ranking and Admissions Metrics as predictors of Overall OD GPA. Click to enlarge
As Table 6 shows, AA OAT and Total ugGPA together explained 22% of the variance in Overall OD GPA (R2 = .22, F(2, 773) = 106.82, p <.001). AA OAT (standardized β = .31, p <.001) was a stronger predictor than Total ugGPA (β = .28, p <.001).
Upon adding UIR to the regression, there was a 2% increase in the predictive power of the model (Model 2 on Table 6) (R2 = .24, F(3, 772) = 79.71, p <.001). In the new model, it was found that all measures, Total ugGPA (standardized β = .33, p <.001), AA OAT (β =.27, p <.001), and UIR (β =.15, p <.001) significantly contributed to the prediction of Overall OD GPA. The addition of UIR to the model led to an increased predictive power of Total ugGPA compared to AA OAT, suggesting that when controlled for UIR, Total ugGPA’s predictive power increases.
First-Year OD GPA
Multiple regression analysis was used to predict First-Year OD GPA using three admissions metrics—AA OAT, Total ugGPA and UIR. The results showed that AA OAT and Total ugGPA together accounted for 29% of the variance (R2=.29, F(2, 773)=156.68, p <.001), with AA OAT (standardized β = .41, p <.001) being the stronger predictor compared to Total ugGPA (standardized β =.27, p <.001).
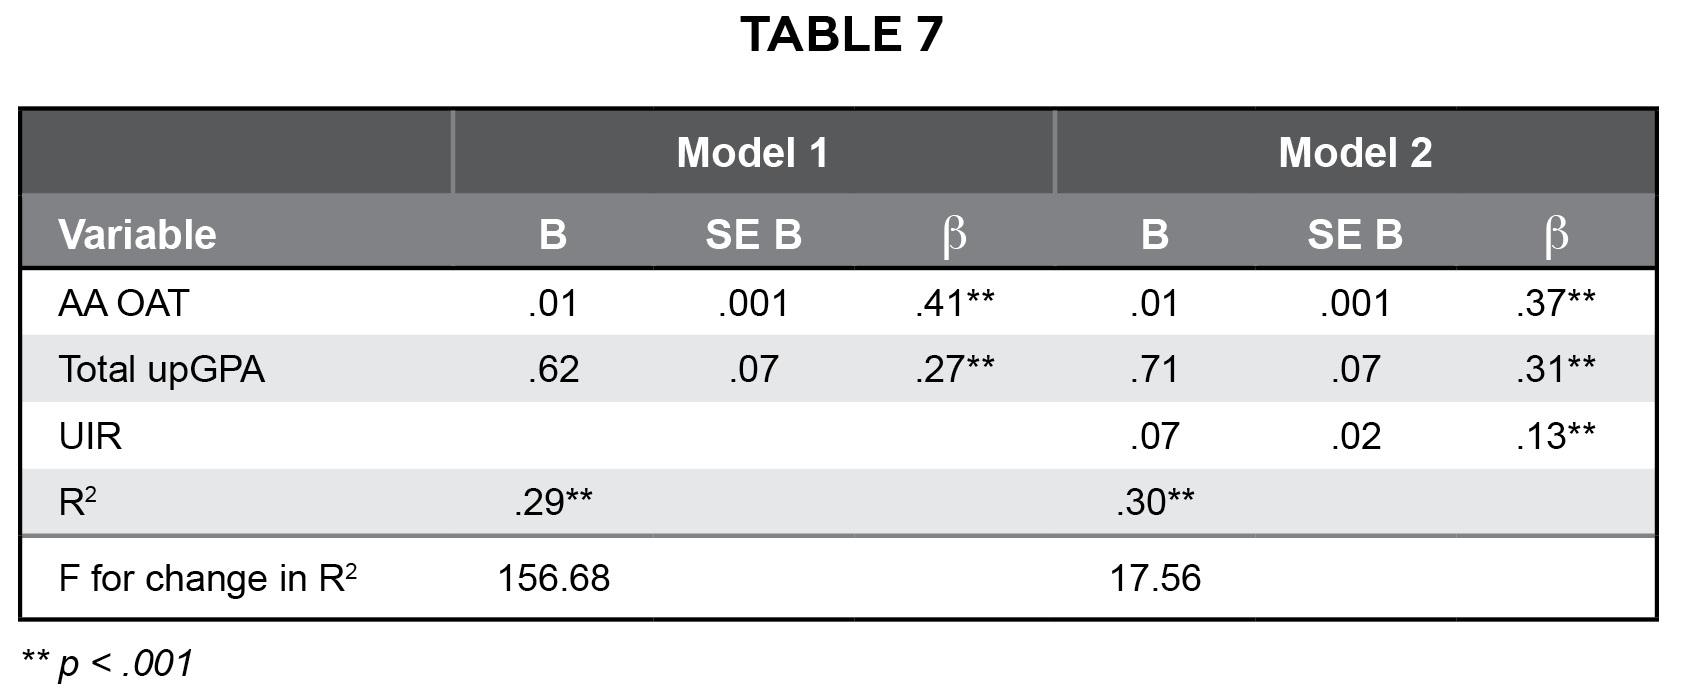
Table 7. Regression – Institutional Rank and Admissions Metrics as Predictors of First Year OD GPA. Click to enlarge
When UIR was included in the multiple regression, the model’s predictive power increased by 1% (Model 2 on Table 7) (R2 = .30, F(1, 722) = 17.56, p <.001). In the new model, all measures, Total ugGPA (β = .31, p <.001), AA OAT (β = .37, p <.001), and UIR (β = .13, p <.001) significantly contributed to predicting first-year GPA. Although UIR increases the standardized beta coefficient for Total ugGPA, unlike with the Overall OD GPA, AA OAT remained the stronger predictor of First-Year OD GPA.
It has been argued that test scores are becoming weaker predictors of success.2,5 This argument was tested using First-Year OD GPA in the professional OD program as a proxy for success. Pearson’s correlational analysis was conducted to examine the relationships between AA OAT and ugGPA to First-Year OD GPA for each entering class. As shown in Figure 1, the correlations between AA OAT and First-Year OD GPA ranged from .40 to .56, while ugGPA ranged from .26 to .49. Correlation for both measures fluctuated year by year. Only in 1 out of 9 years ugGPA showed a stronger correlation with First-Year OD GPA than the OAT. In the last 2 years of the analysis, AA OAT had a stronger correlation coefficient with First-Year OD GPA.
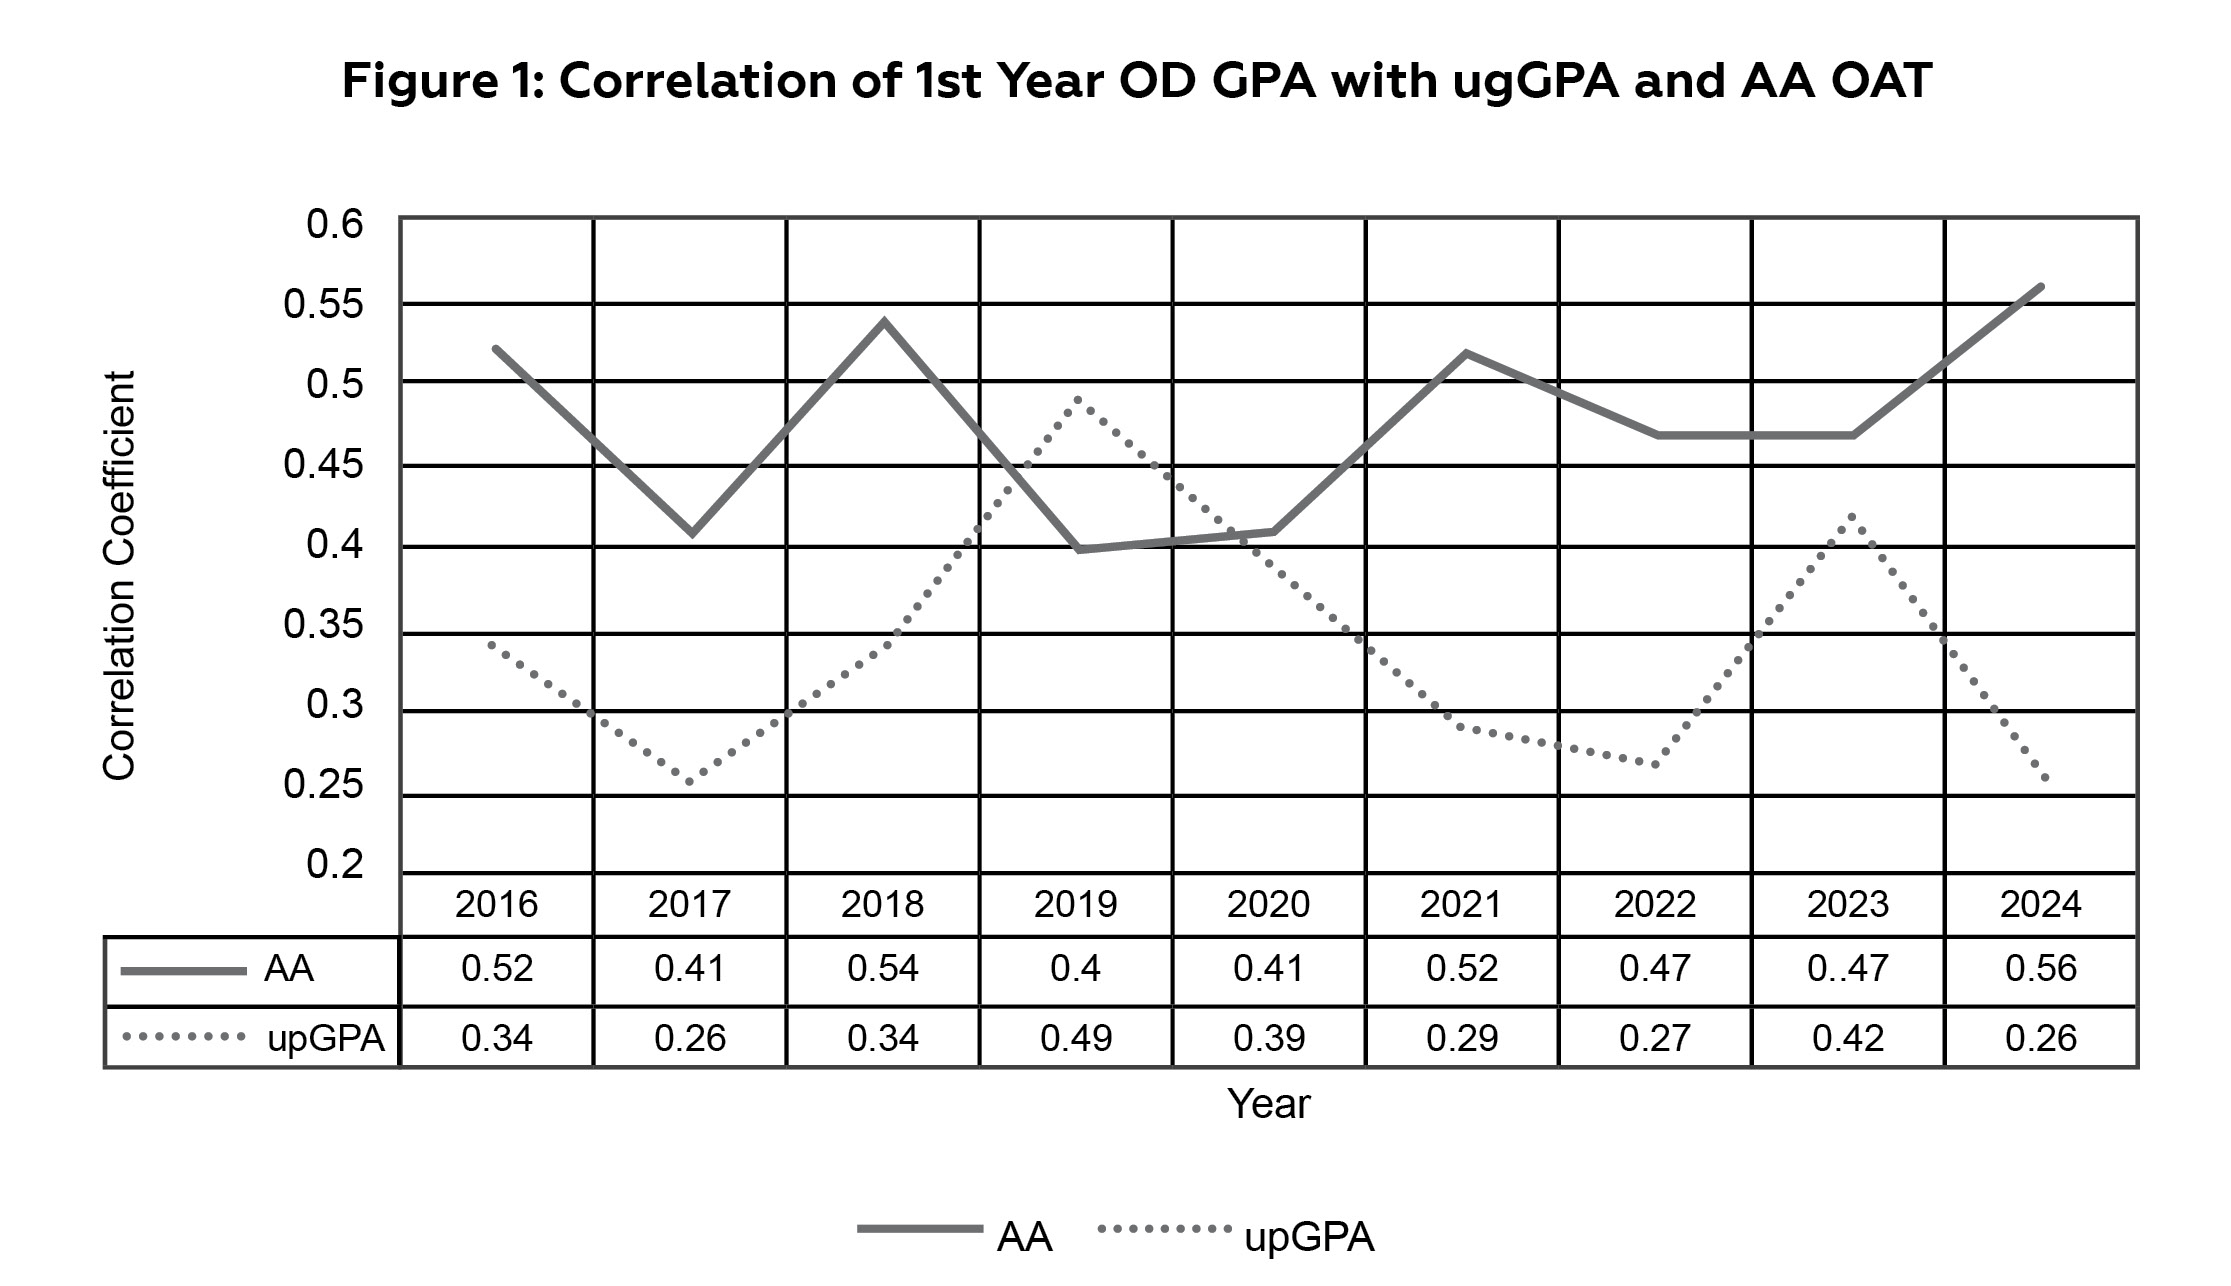
Figure 1. Pearson’s Correlation of ugGPA and AA OAT. Click to enlarge
Clinical Performance
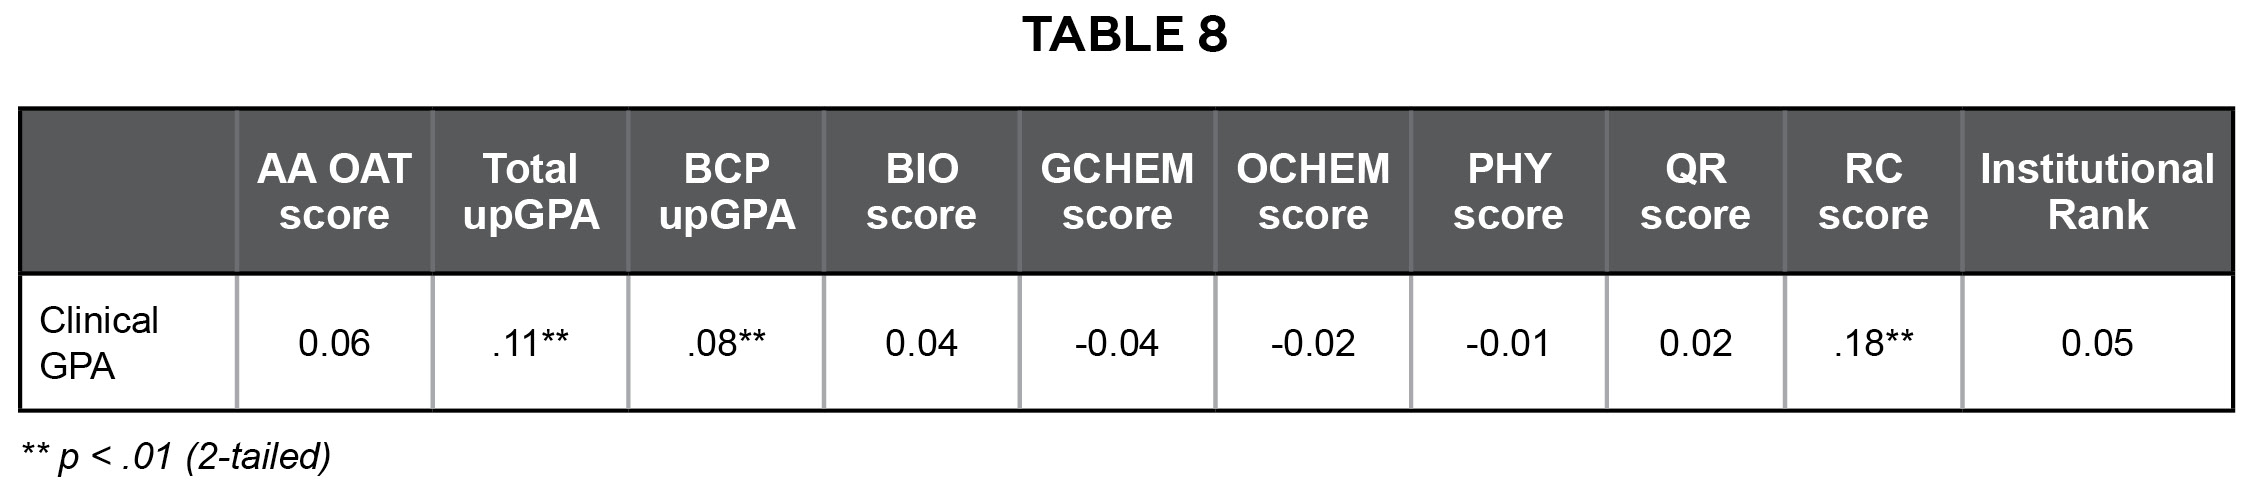
Table 8. Pearson’s Correlation Between Clinical OD GPA and AA OAT, Subsections of the OAT, UG Total and BCP. Click to enlarge
As determined earlier, Clinical OD GPA correlates poorly with admissions metrics and does not have a linear relationship with OAT scores. The three admissions metrics that have linear relationships with Clinical GPA are the Reading Comprehension section of the OAT (r = .12, p = .01), and Total ugGPA, and BCP ugGPA (r = .19, and .14, p = .01, respectively) are shown in Table 8.
Clinical GPA and Admissions Metrics
Figure 2 shows that although the relationship between AA OAT is not linear, students at the high end of the OAT range also command higher clinical GPA. This distribution suggests that, although AA OAT scores may not directly predict Clinical GPA performance, higher OAT scores might be an indicator of potential academic success in the clinical setting. However, students at the lower end of the OAT scale, perform relatively well in the clinical component of the program.
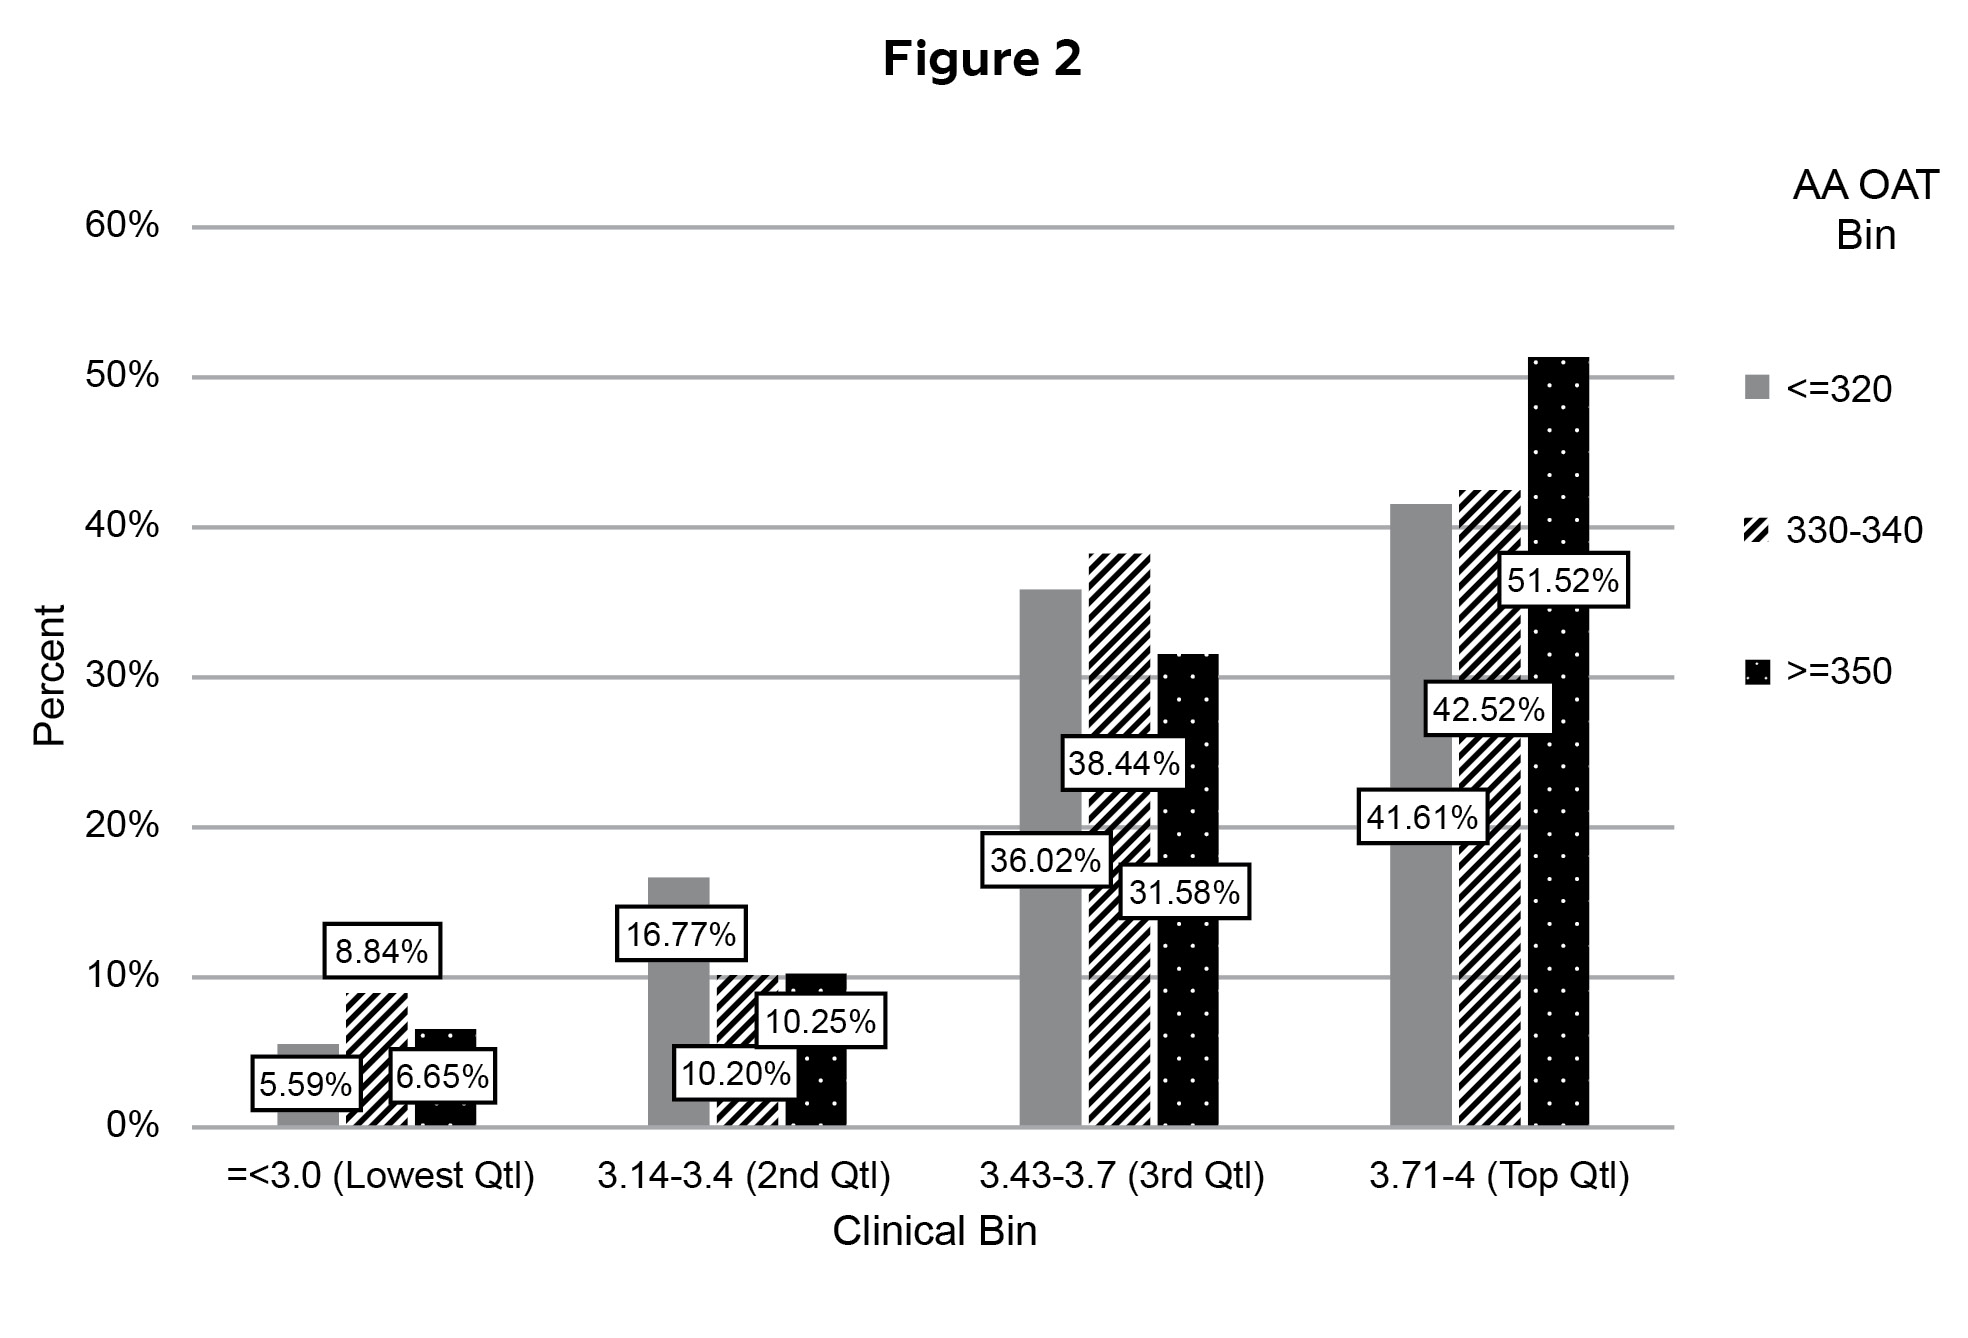
Figure 2. Relationship between Clinical OD GPA (Binned) and AA OAT (Binned). Click to enlarge
An ordinal logistic regression was conducted to examine the relationship between OAT score groupings (≤320, 330–340, ≥350) and Clinical GPA quartiles. The model significantly improved prediction over the intercept-only model, χ²(2) = 6.261, p = .044, although it explained little variance (Nagelkerke R² = .008). Goodness-of-fit tests indicated adequate model fit (Pearson χ²(4) = 5.802, p = .214; Deviance χ²(4) = 5.941, p = .204). Compared to students with OAT scores ≥350, students in the ≤320 group had significantly lower odds of achieving higher Clinical GPA quartiles (estimate = -0.366, p = .039), as did students in the 330–340 group (estimate = -0.309, p = .036). Although the associations reached statistical significance, the effect sizes were small.
Relationship Between OAT Scores and Academic Progress: Repetition and Dismissal
This section analyzes demographics and admissions metrics of students who were either dismissed from the program or repeated at least one academic year. Of the total number of students, 7.4% (63) repeated or were dismissed.
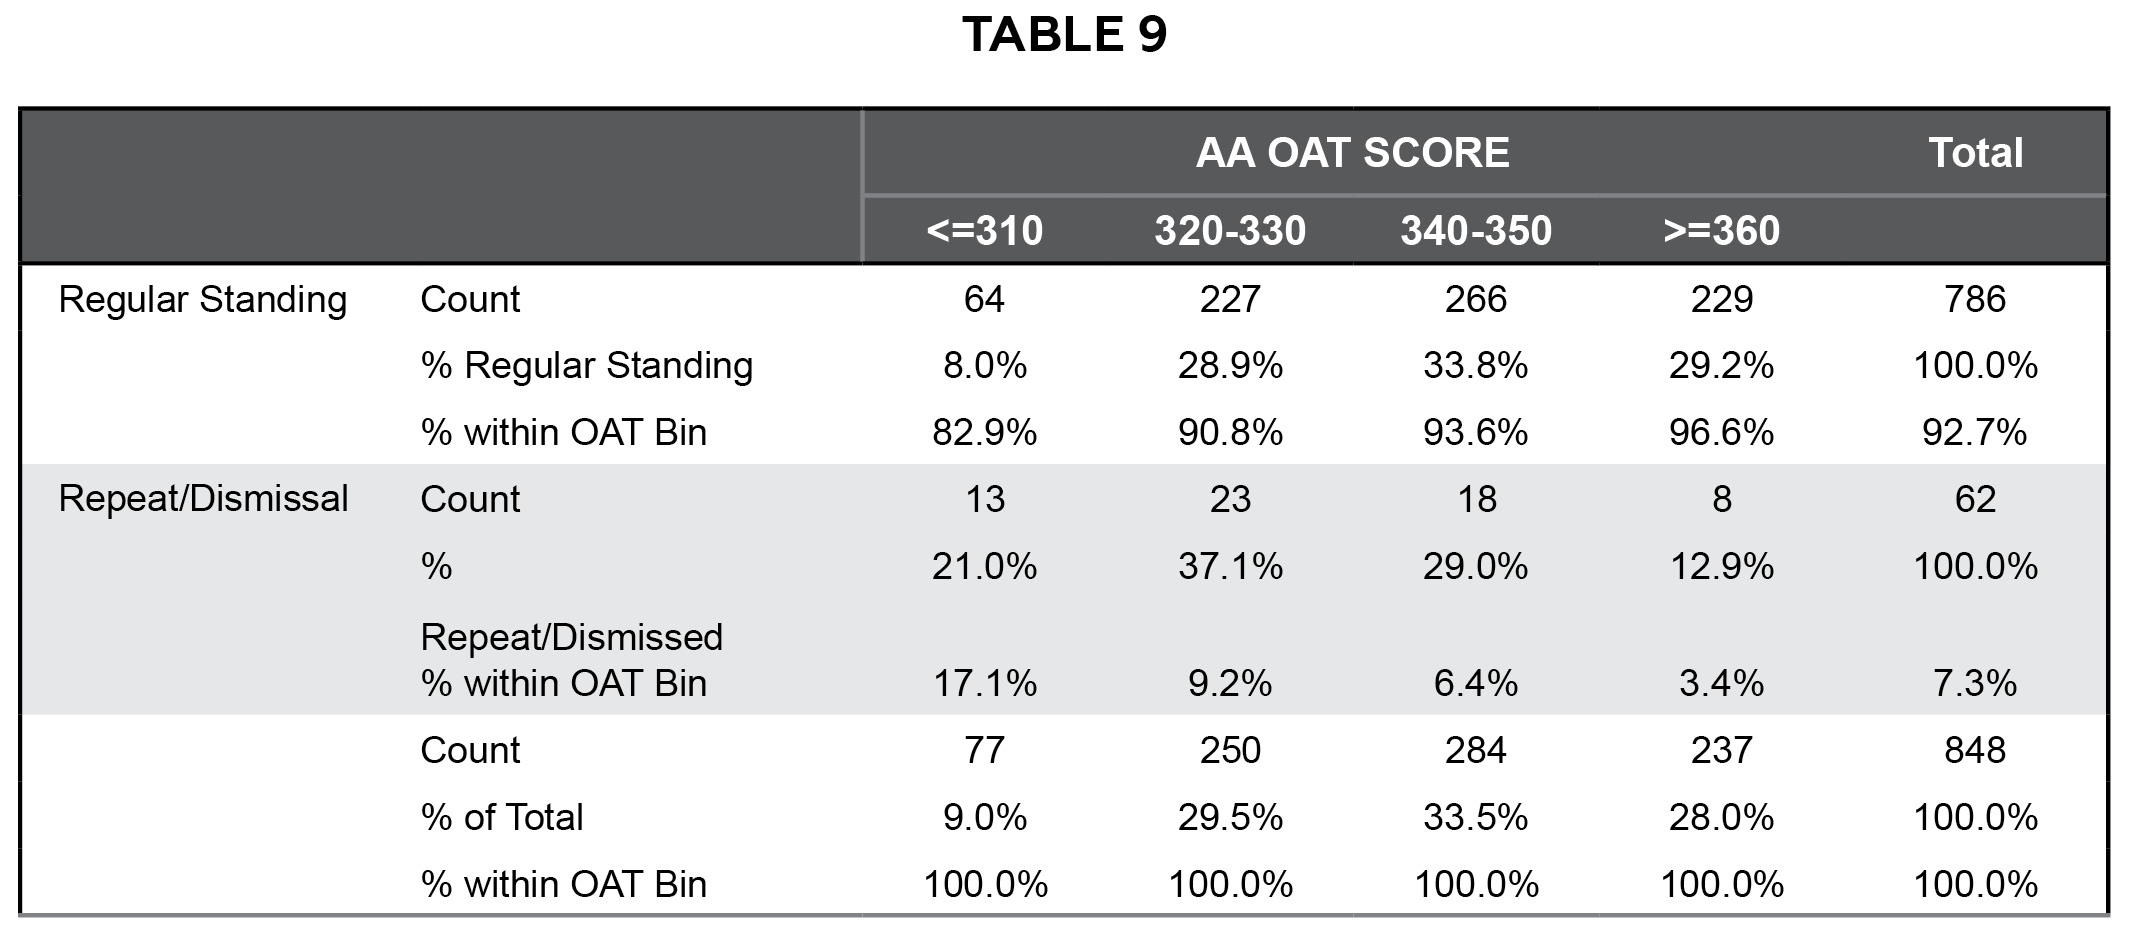
Table 9. AA OAT by Repeats and Dismissals. Click to enlarge
Table 9 shows the percentage of students who repeated a year or were dismissed from the program by AA OAT band. Among the total sample, students in the <=310 AA OAT range represented 9% (76), and 17% (13) of them repeated or were dismissed. For students in the 320-330 band, which represented 29.5% (249) of the sample, 9.2% (23) repeated or were dismissed. Students in the 340-350, which represented 33.5% (283) of the sample, 6.4% (18) were dismissed or repeated. Finally, students in the >=360 band represented 28% (237) of the sample, and 3.4% (8) repeated or were dismissed.
OAT Scores and NBEO Part I Performance
In examining the relationship between students’ first-time NBEO Part I performance and OAT scores, Pearson coefficient correlations were computed to assess the linear relationship between the OAT and its subsections with NBEO Part I board scores. As seen in Table 10, all OAT scores correlate positively and significantly with overall board scores. AA OAT had the strongest correlation with board scores.
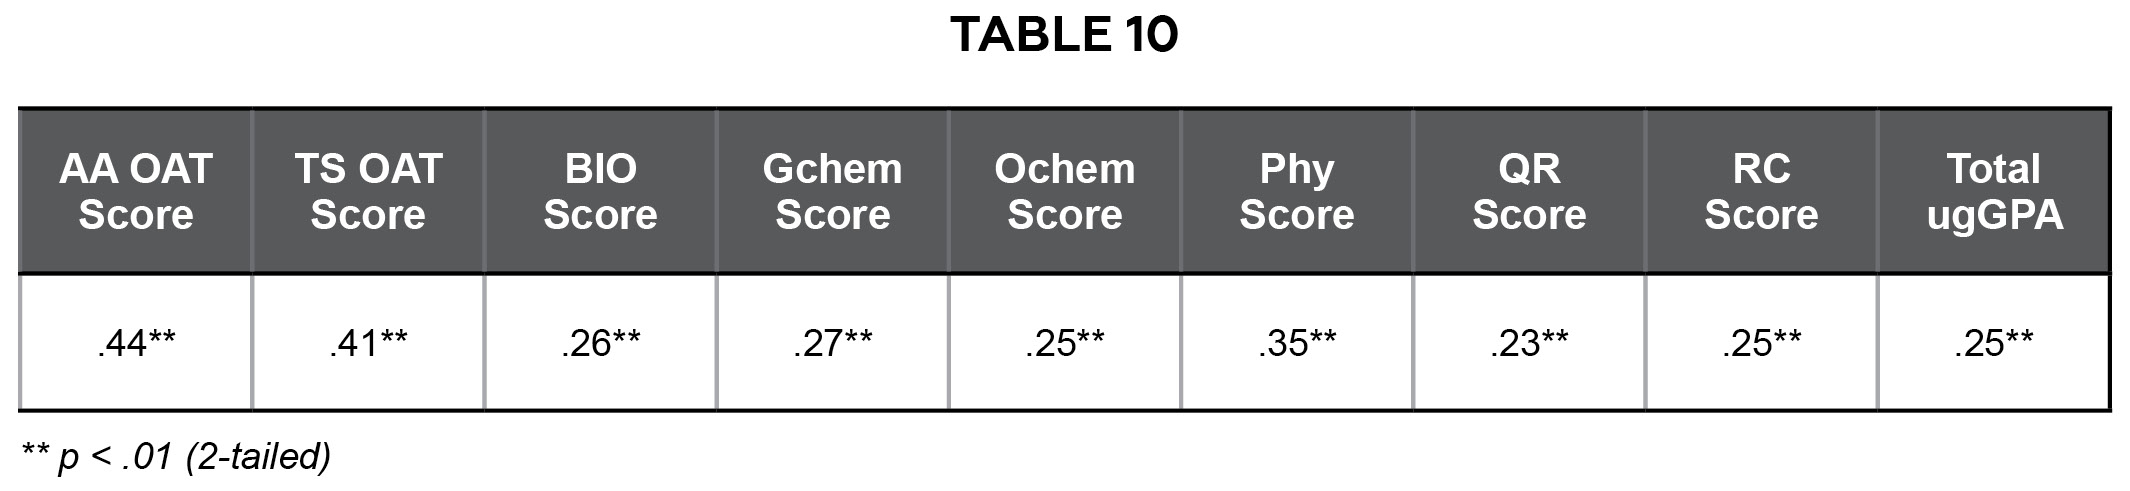
Table 10. Pearson’s Correlations Between OAT scores and NBEO Part I Scores. Click to enlarge
Overall Boards Scores and Admissions Metrics
Multiple regression analysis was employed to predict NBEO Part I scores using three admissions metrics—AA OAT, Total ugGPA and UIR—along with Didactic GPA. Using an enter method, the AA OAT score explained 19% of the variance in Board scores, while Total ugGPA and institutional rank increased predictive power by 3% (Models 1 and 2 on Table 11). Combined, the admissions metrics alone accounted for 22% of the variability in Overall Boards Score (R2 = .22, F(2,724) = 14.9, p <.001). AA OAT (β = .37, p <.001), Total ugGPA (β = .18, p <.001) and UIR (β = .09, p < .00) contributed significantly to the prediction.
When Didactic GPA was added to the model, the predictive power increased by 30% percentage points, with all variables together accounting for 52% of the variance in NBEO Part I scores. In the final model (Model 3) the only significant predictors were AA OAT and Didactic GPA.
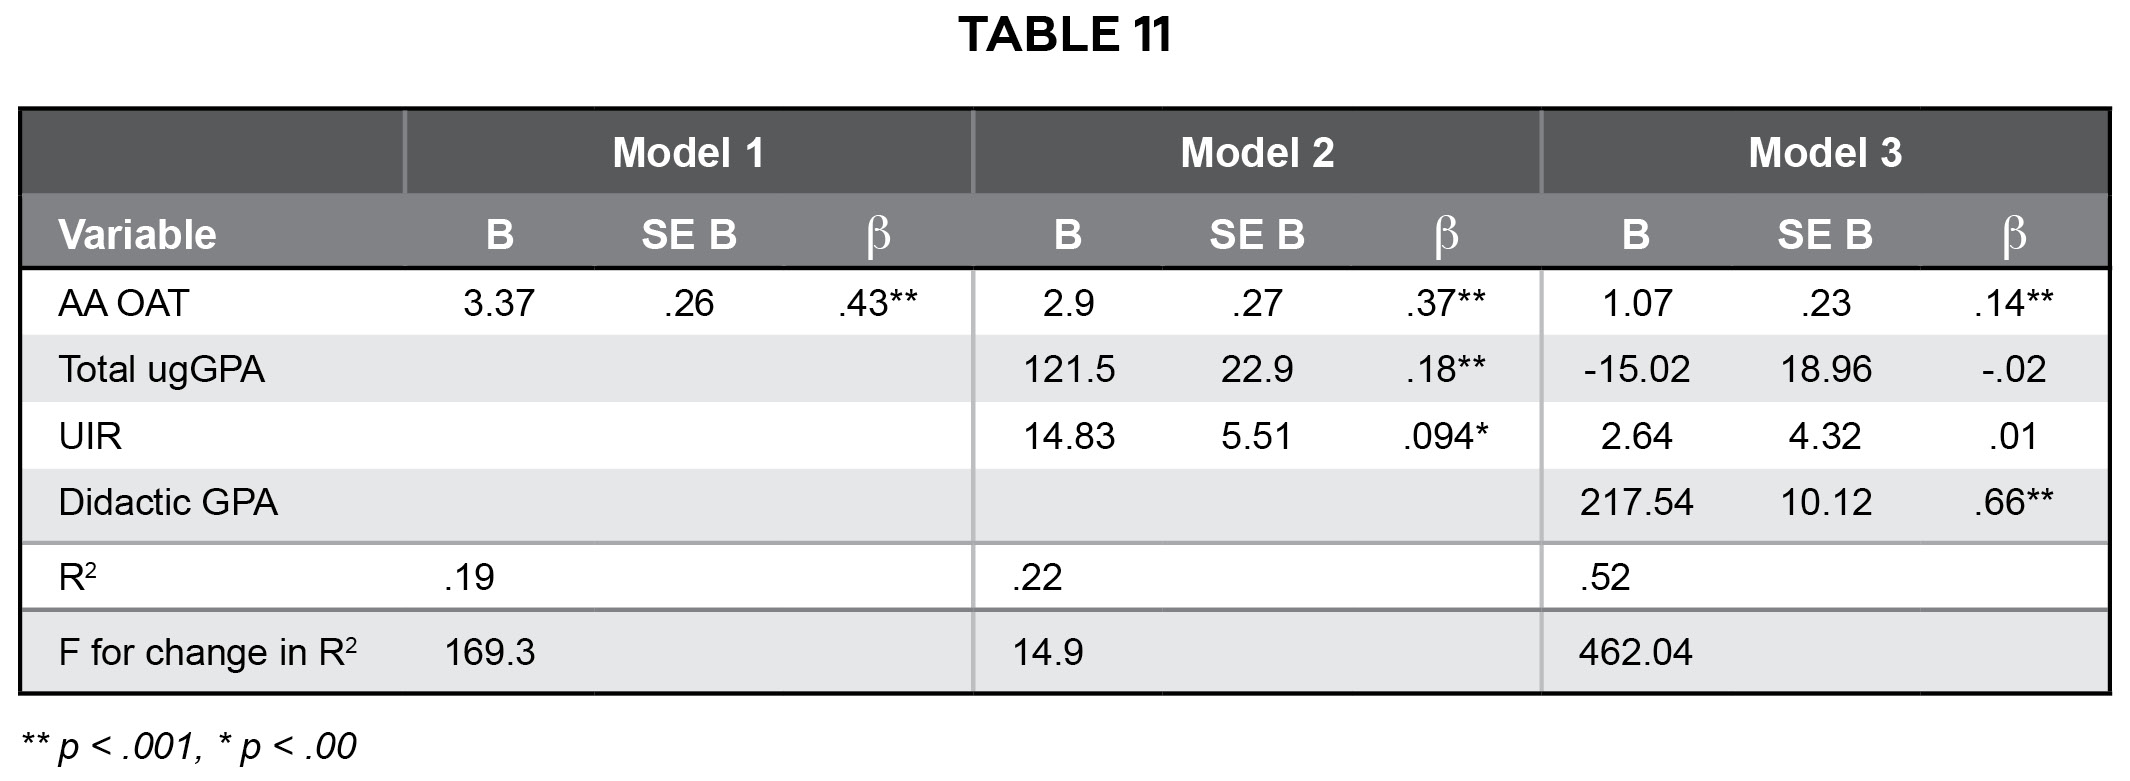
Table 11. Multiple Regression – Admissions Metrics (AA OAT, Total ugGPA, and Institutional Rank) as predictors of Boards. Click to enlarge
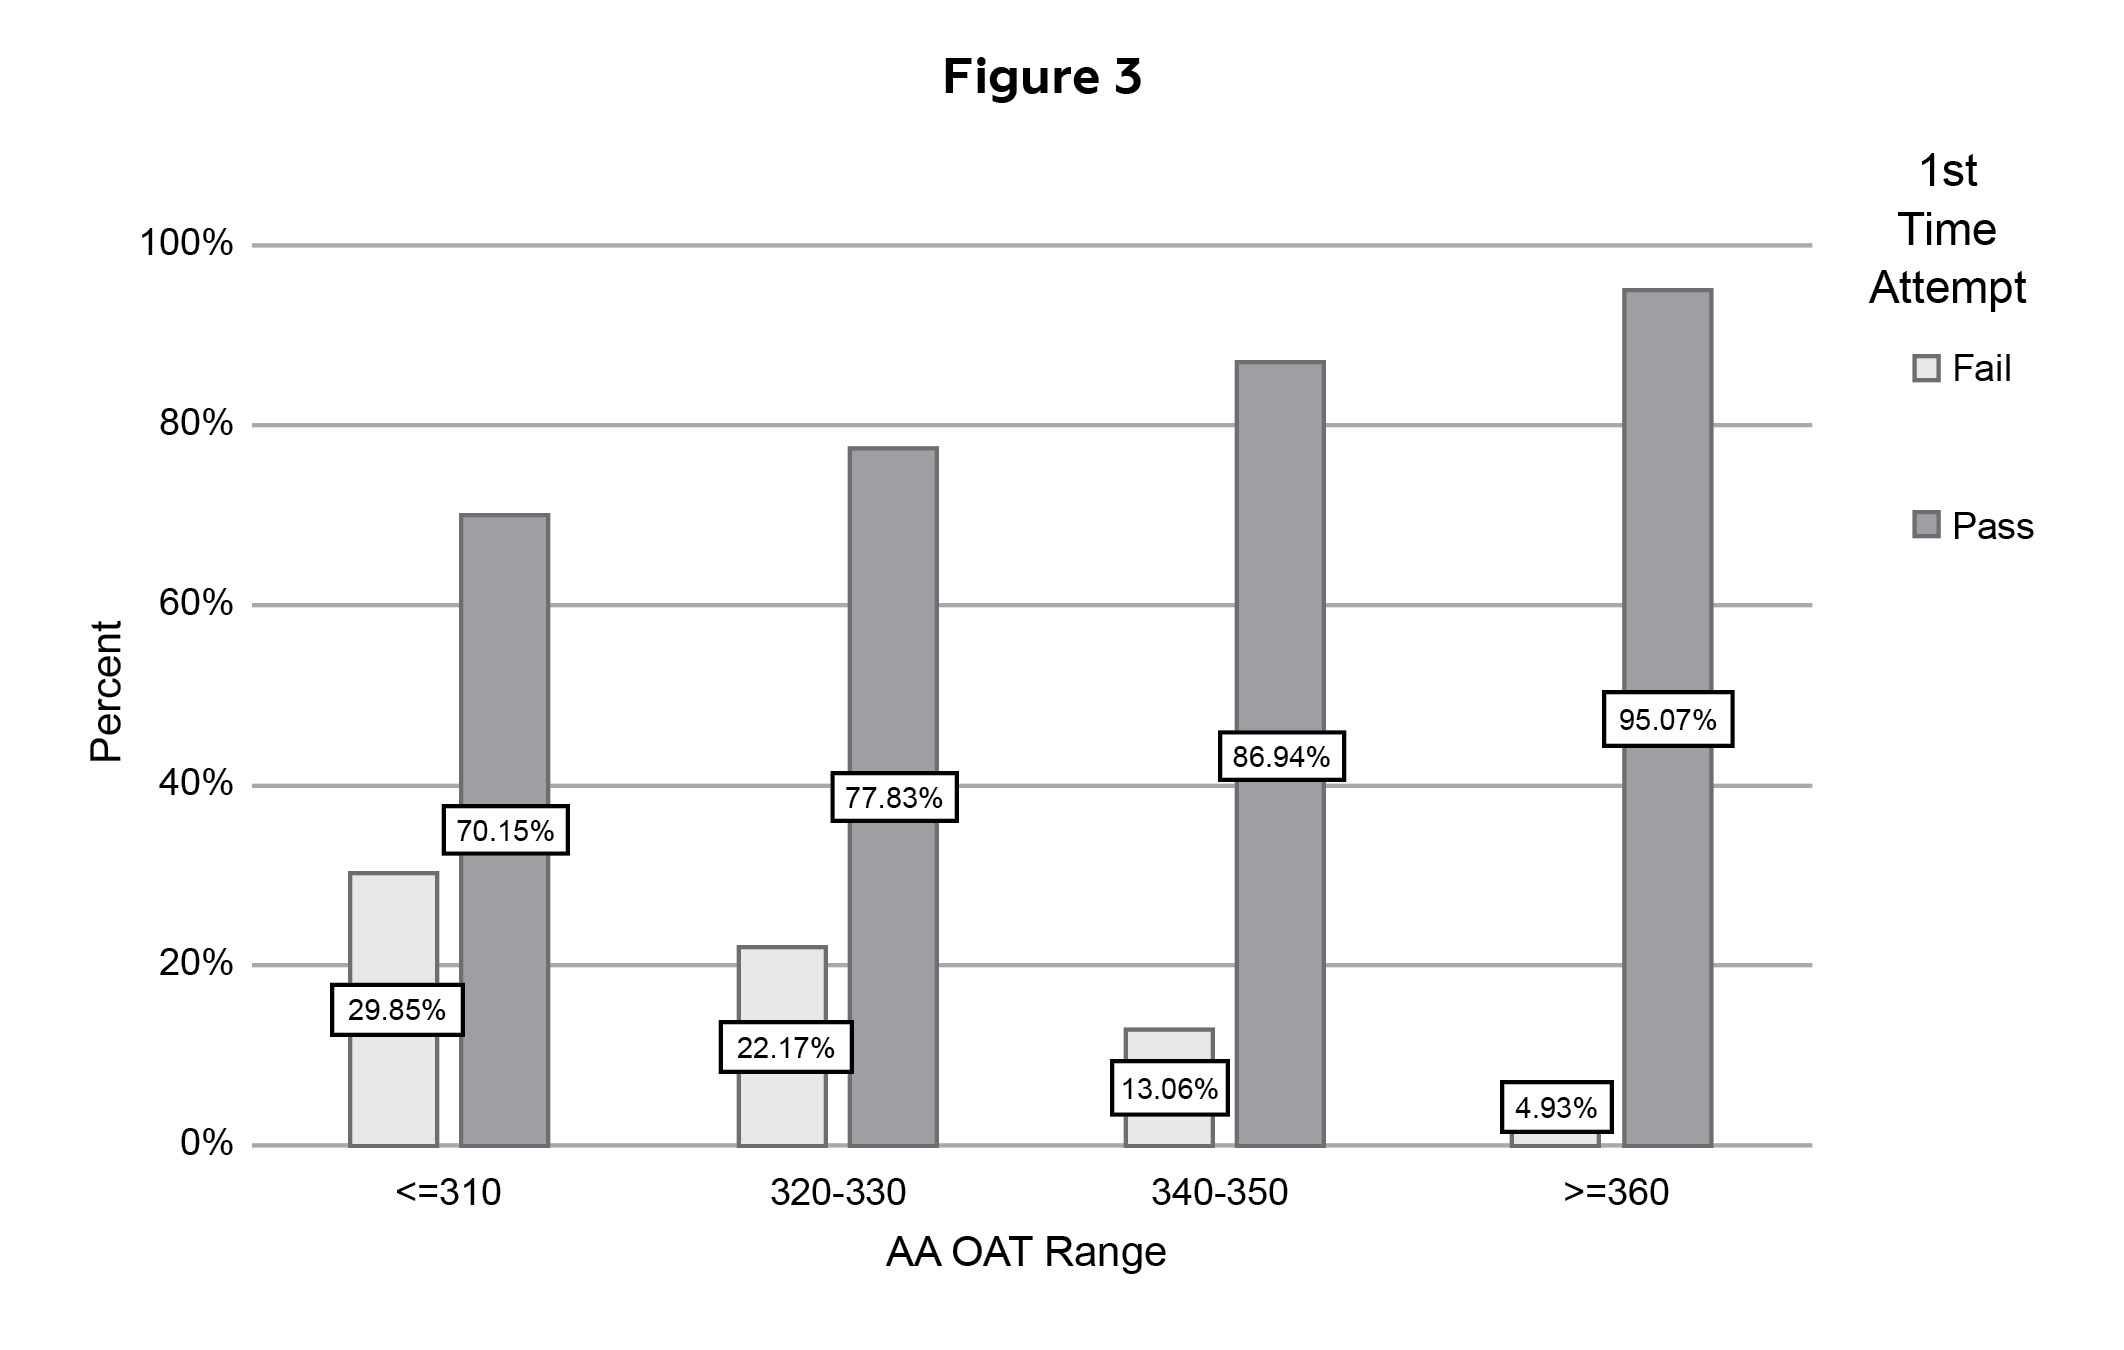
Figure 3. Relationship Between Boards Passing and AA OAT Scores (Binned). Click to enlarge
Pass/Fail. Since the NBEO Part I is a pass/fail threshold exam, this section explores the relationship between students’ OAT scores and their likelihood of passing the NBEO Part I on the first attempt. Figure 3 shows that 29.9% (20) of students in the <=310 AA OAT band did not pass NBEO Part I in the first attempt, compared to 22.2% (51) in the 320-340 bin, 13.1% (35) in the 340-350 band, and 4.9% (11) in the >=360 band. The difference was statistically significant, c2 (1, 788) = 39.7, p <.00).
Discussion
Given the ongoing debate regarding the use of the OAT as an admissions tool, this study examined whether the OAT serves as a reliable predictor of performance in optometry school.
The OAT was positively associated with various markers of academic success, including first-year GPA, overall GPA, NBEO Part 1 scores and pass rate, and uninterrupted progress in the optometry program.
Some argue that the OAT is becoming a weaker predictor of success, and that the term ‘success’ is subjective and may have different meanings.5 Although we agree that success can be defined in many ways, based on the markers defined by this analysis, the OAT is a valid and reliable predictor of academic achievement in optometry school. Moreover, this study does not support the claim that the predictive power of the OAT is diminishing. In fact, based on data from the Association of Schools and Colleges of Optometry (ASCO), the average ugGPA for all schools of optometry has increased over the past 5 years. This could be an indication that schools are becoming more selective or that ugGPAs are inflated, making standardized tests ever more relevant in the admissions equation.16
It is a commonly held view that the OAT is not an infallible predictor of success, a sentiment often expressed anecdotally by faculty and administrators evidenced by statements such as ‘there are students who do well on the OAT but who also have academic difficulties.’ However, this perspective overlooks the fact that it is unrealistic to expect any single test to serve as a perfect and exclusive predictor of success in any aspect of human endeavor. The OAT is a tool for predicting success, but like with any tool, it has limitations. The OAT explains up to 22% of a student’s first-year GPA. While this could be the difference between passing or not, there is still 78% of the variance of a student’s grade that is explained by other factors. When ugGPA and institutional rating is added to the model, the combined explanatory power increases to 33%. There is still 67% of the variance in grades that remains unexplained by these variables. Although not ideal, the explanatory power of these variables is consistently valid and reliable.
Furthermore, this study shows that ugGPA alone explained 13% and that the addition of OAT to the model more than doubled the predictive power of first-year GPA. Any tool with the ability to increase predictive power by this much should not be dismissed or excluded from a holistic admissions process.15
This study shows that for all measures of GPA in the professional program, the predictive power of ugGPA increases when accounting for institutional ranking, lending support to the familiar adage that “not all GPAs are created equal.” Students in schools with higher institutional rankings tend to have lower ugGPAs. Thus, by eliminating the OAT, schools would have to rely on fewer objective markers of success, ugGPA and quality of undergraduate education probably becoming the main focal points, potentially disadvantaging students from lower ranked institutions. The OAT allows for students from lower ranking institutions with reasonable OAT scores to demonstrate to the admissions committee that they have the requisites necessary to succeed.
The relationship between OAT scores and clinical performance has not been widely examined in the optometric literature, although prior studies have established the relationship between standardized tests and clerkship performance in medical school.1 In this study, students with lower OAT scores had significantly lower odds of achieving higher clinical GPA quartiles, though the effect sizes were small.
This study supports previous findings17 indicating that NBEO Part I performance is primarily predicted by Didactic GPA within the professional program. The addition of OAT to the model further increased its predictive power. In contrast, when admissions metrics and Didactic GPA variables were included together, Total ugGPA did not contribute significantly to the model. In addition, students with lower AA OAT are significantly more likely to not pass Part 1 on the first attempt.
This study shows the potential for academic and clinical excellence among students in lower OAT bands. Conversely, this study also shows that students in lower bands of the OAT have higher chances of struggling academically and on Part I of the NBEO exam. Therefore, students in lower OAT bands may require access to adequate, accessible support services in their academic journeys. Schools considering changes to OAT-related policies must be transparent about their ability to invest the necessary human and financial resources to provide remedial academic support to the students who may require it.18
There are calls for barriers to be removed, the OAT being one of them, from admissions processes to expand access to underrepresented groups who have faced systemic discrimination.6 Evidence suggests that test-optional policies have not yielded the anticipated increases in representation of underrepresented students on college campuses.18–20 In fact, studies indicate that these policies may be “insufficient” in achieving meaningful transformation and may instead enhance the selectivity and prestige of the institutions that adopt them.19 By removing a valid measure of success, we risk unintended consequences and unanticipated changes. Research indicates that without standardized tests, admissions committees may be compelled to emphasize criteria that could disproportionately benefit White, Asian and affluent students, such as extracurricular activities, personal statements, advanced coursework and school rankings.19
Medical and optometry schools have successfully increased the enrollment of racially underrepresented students without eliminating standardized tests.21 To genuinely support and advocate for underrepresented students, it is crucial to maintain a balanced approach that incorporates valid assessments while implementing targeted strategies to enhance diversity and inclusion in the admissions process. Strategies such as culturally responsive recruitment, intentional outreach, holistic admissions processes and broadening acceptable score ranges have proven effective in diversifying the profession.19–21 In addition, they can expand opportunities for applicants to meet these standards—for example, by creating pathway programs that offer academic and financial support tailored to the OAT and nurture students’ community cultural wealth.21
Students accepted without a standardized measure of knowledge and academic achievement may lack the requisite knowledge, study strategies and academic habits required to perform in rigorous health professions programs, potentially leading to academic failure and dismissal. This study supports the notion that students at lower ranges in the OATs tend to be more prone to academic difficulty, including dismissal. The cost of failure in optometry school should not been taken lightly. Struggling students often present with high levels of anxiety, depression and shame, an emotion strongly associated with mental health challenges such as addiction and post-traumatic stress disorder.22 In addition to the psychological toll, failing to complete the OD program or obtain licensure can result in significant financial burdens that may take years to overcome.
Limitations of this Study
Restriction of range is a common weakness of studies in health care programs attempting to study the relationship between standardized tests and academic and clinical performance. This weakness is applicable to this study, as students analyzed here had AA OAT scores at the higher end of the OAT range. Based on the performance and persistence by AA OAT bands presented here, it is a logical conclusion that students in lower ranges would likely have higher rates of underperformance and failure. This is not to say that they could not perform well in the program, but that they are considerably more likely to struggle. This study is also the snapshot of one school of optometry. Similar analysis should be made including a larger group of schools. In addition, future research is needed to determine whether students with lower OAT scores are more likely to fail the NBEO Part I multiple times, and whether higher scorers are more likely to be accepted into residency programs.
Conclusion
The OAT is a high stakes examination used by admissions committees across the country to make admissions decisions. As with any admission metric, the OAT may present a barrier to potentially qualified students. As such, the validity of the OAT as a tool for admissions committees needs to be confirmed. This study adds to the body of research providing empirical evidence of the validity of the OAT in predicting various forms of academic performance, including first-year and overall GPA, retention and successfully passing Part 1 of the NBEO licensing examination. This study supports the use of the OAT as one component of a holistic admissions process for the OD program, but not as the sole basis for rejecting applicants. The finding that lower OAT scores are associated with higher rates of academic struggle and dismissal suggests that standardized tests serve as valuable, though imperfect, early indicators of academic risk. As discussed in prior research, drastic changes in admissions testing policies can lead to both intended and unintended consequences, including psychosocial, emotional and financial impacts on students and institutions. Admissions committees have to successfully balance the need to increase access to a diverse class, while at the same time enroll those who are most likely to succeed, avoiding the costly consequences of failure. While this is no easy feat, there are options that can be further explored.
References
- Hanson JT, Busche K, Elks ML, et al. The validity of MCAT scores in predicting students’ performance and progress in medical school: Results from a multisite study. Acad Med. 2022;97(9):1374-1384. DOI:10.1097/ACM.0000000000004754
- Jakirlic N, Ooley C, Hoppe E. Standardized tests as predictors of success in health professions education: A scoping review. Optom Educ. 2021;47(1).
- Ooley C, Jakirlic N, Hoppe E. Review of standardized testing in doctoral health professions admission requirements. Optom Educ. 2021;47(1).
- Goodwin D, Ricks JA, Fish BB, Kelsey NJ, Remington LA, Bodner TE. Defining and measuring success. Optom Educ. 2007;32(3):85-90.
- Bonanno JA. IU School of Optometry moving to admission test-optional approach [Internet]. Indiana University School of Optometry News. 2020 July 6 [Cited May 1, 2025]. Available from: https://blogs.iu.edu/iusonews/2020/07/06/iu-school-of-optometry-moving-to-admission-test-optional/
- Kim EY. Yale prof proposes replacing MCAT in med school admissions [Internet]. Yale Daily News. 2018 October 11. [Cited May 4, 2025]. Available from: https://yaledailynews.com/blog/2018/09/11/yale-prof-proposes-replacing-mcat-in-med-school-admissions/.
- Diep F. Harvard returns to requiring standardized tests [Internet]. The Chronicle of Higher Education. 2024 April 11. [Cited May 8, 2025]. Available from: https://www.chronicle.com/article/following-yale-and-brown-harvard-returns-to-requiring-standardized-tests.
- Hellmann M. US universities are reinstating SAT scores [Internet]. Experts say it will exacerbate racial inequality. The Guardian. 2024 June 20. [Cited May 8, 2025]. Available from: https://www.theguardian.com/us-news/article/2024/jun/20/university-require-sat-act-test-diversity.
- The Optometry Admission Test (OAT) [Internet]. Optometry Admissions Test. [Cited May 4, 2025]. Available from: https://oat.ada.org/
- Association of Schools and Colleges of Optometry. Frequently asked questions about the optometry admission test (OAT) [Internet]. [Cited May 1, 2025]. Available from: https://optometriceducation.org/future-students/resources/frequently-asked-questions-about-the-optometry-admission-test-oat
- Sklar DP. Preparation for medical school: Reflections on the MCAT exam, premedical education, and the medical school application process. Acad Med. 2013;88(5):553-554. DOI:10.1097/ACM.0B013E31828B7C8F
- Schwartz S. In Response to “Review of Standardized Testing in Doctoral Health Professions Admission Requirements.” Optom Educ. 2022;47(2).
- Saguil A, Dong T, Gingerich R, et al. Does the MCAT predict medical school and PGY-1 performance? Mil Med. 2015;180(4):4-11. DOI:10.7205/MILMED-D-14-00550
- Optometry Admissions Test. Optometry Admission Test (OAT) Validity Study [Internet]. 2024 [Cited May 1, 2025]. Available from: https://oat.ada.org/-/media/project/ada-organization/ada/oat/files/oat_validity_study.pdf?rev=f07cca5f5d94488fbea018d3d2e2c74c&hash=F76579656D1E53CF77123960359AF7F2.
- Veloski JJ, Callahan CA, Xu G, Hojat M, Nash DB. Prediction of students’ performances on licensing examinations using age, race, sex, undergraduate GPAs, and MCAT scores. Acad Med. 2000;75(10):S28-S30. DOI: 10.1097/00001888-200010001-00009
- Denning J, Eide E, Mumford K, Patterson R, Warnick M. The grade inflation conversation we’re not having [Internet]. Chron High Educ. 2023 April 13 [Cited May 8, 2025]. Available from: https://www.chronicle.com/article/the-grade-inflation-conversation-were-not-having
- Bailey JE, Yackle KA, Yuen MT, Voorhees LI. Preoptometry and optometry school grade point average and optometry admissions test scores as predictors of performance on the National Board of Examiners in Optometry Part I (Basic Science) Examination. Optom Vis Sci. 2000;77(4):188-193. DOI:10.1097/00006324-200004000-00010
- Belasco AS, Rosinger KO, Hearn JC. The test-optional movement at America’s selective liberal arts colleges: A boon for equity or something else? Educ Eval Policy Anal. 2015;37(2):206-223. DOI:10.3102/0162373714537350
- Bennett CT. Untested admissions: Examining changes in application behaviors and student demographics under test-optional policies. Am Educ Res J. 2022;59(1):180-216. DOI:10.3102/00028312211003526
- Cahn PS. Do health professions graduate programs increase diversity by not requiring the graduate record examination for admission? J Allied Health. 2015 Spring;44(1):51-56. [Cited May 7, 2025]. http://www.ncbi.nlm.nih.gov/pubmed/25743401
- Alberto C, Albieri G. Recruiting racially minoritized students to optometry school. The Advisor. 2021;41(4).
- Bynum WE, Artino AR. Who am I, and who do I strive to be? Applying a theory of self-conscious emotions to medical education. Acad Med. 2018;93(6):874-880. DOI:10.1097/ACM.0000000000001970